
Figure 2.
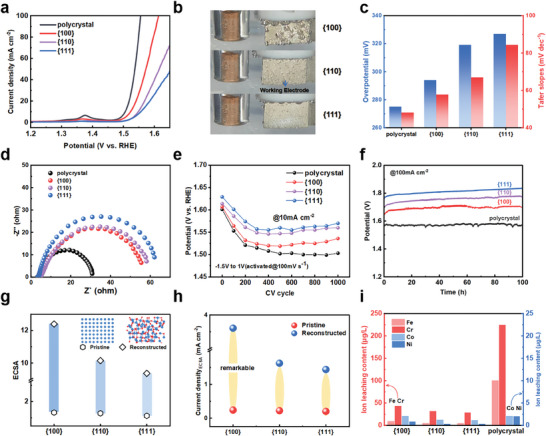
OER performance. a) OER polarization curves. b) OER performance of different crystal facets at 1.5 V versus RHE. c) Overpotential and tafel slope. d) Electrochemical impedance spectroscopy. e)The CV activation process of 100 mV s−1. f) Catalytic stability measured by chronopotentiometry in 1 m KOH at room temperature. g)The value of ECSA. h)The experimentally measured normalized current density (@ 1.50 V versus RHE) of the pristine and reconstructed. i) ICP‐MS analysis of electrolyte solutions after reconstruction.