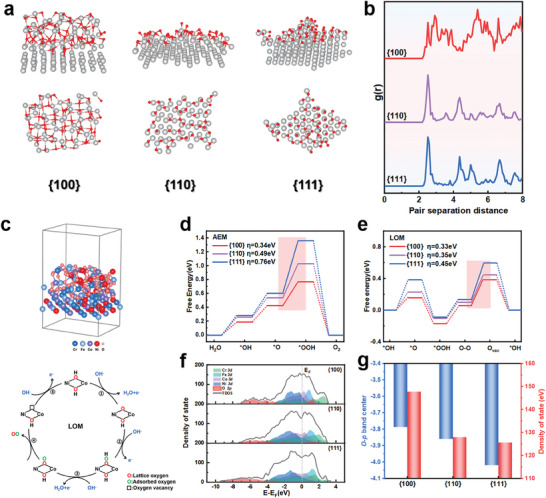
Figure 4.

DFT calculation. a) The oxidation degree on the single crystal surface. b) Radial distribution function. c) Structural modeling of {100}and schematic illustration of LOM pathway. d) The Gibbs free energy diagrams of OER of the AEM pathway. e) The Gibbs free energy diagrams of OER of the LOM pathway. f) Total density of states and projected density of states. g) d‐band center and total density of states at the Fermi level.
