. 2024 Jul 20;73(10):e332290. doi: 10.1136/gutjnl-2024-332290

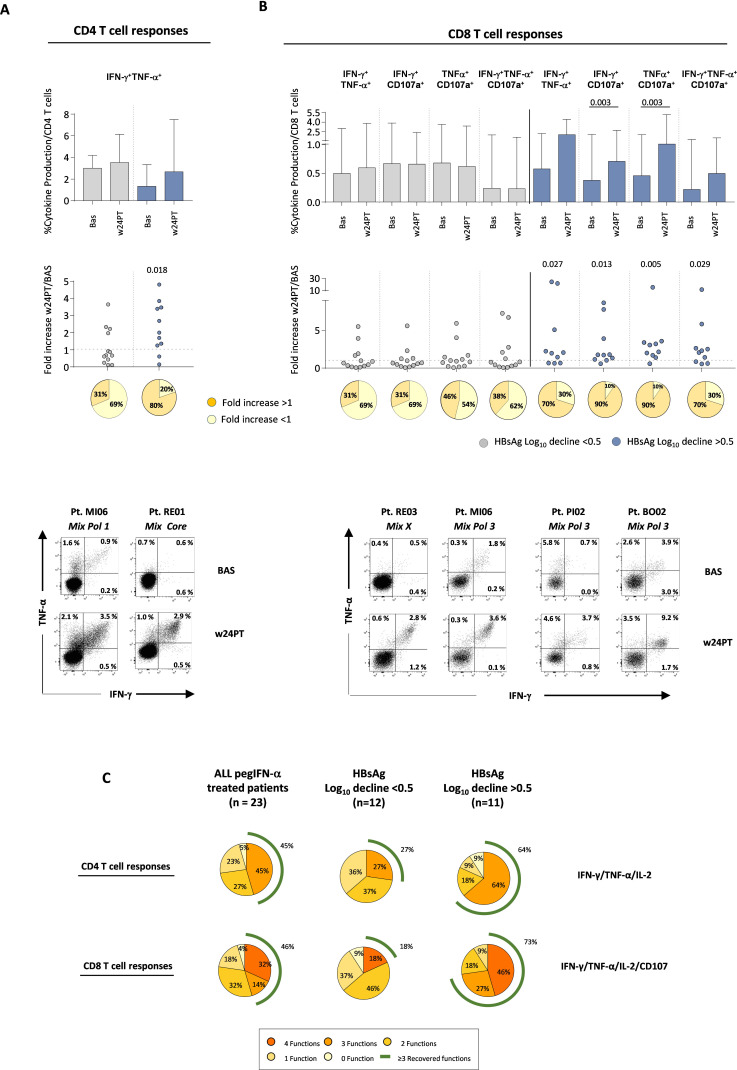
Figure 4. Polyfunctional HBV-specific T cell responses. (A) Columns show the median frequency at baseline and w24PT of HBV-specific CD4 T cells able to produce simultaneously the indicated cytokines in response to all peptide pools after in vitro stimulation (with interquartile interval) from patients receiving pegIFN-α with HBsAg log reductions lower or greater than 0.5 (grey and blue, respectively). The dotted chart shows the ratio between the cytokine production detected at w24PT relative to baseline for each patient belonging to the two different groups. Statistics by the Wilcoxon matched-paired test and by the Wilcoxon signed-rank test. Pie charts below show the percentage of patients able to improve cytokine production with a fold increase value higher than 1 (orange pies). (B) CD8 T cells able to produce simultaneously the indicated cytokines and to degranulate are illustrated as in (A). Representative dot plots of CD4 and CD8 T cell responses from treated patients are shown at the bottom of the panel. (C) Pie charts show the percentage of patients able to improve either none or multiple CD4 and CD8 HBV-specific T cell functions simultaneously. Left, middle and right pie charts refer to the whole patient population receiving pegIFN-α, and to patient subgroups with HBsAg log decline <0.5 or >0.5, respectively. BAS, baseline; HBsAg, hepatitis B surface antigen; IFN-γ, interferon-gamma; IL, interleukin; log10, logarithm base 10; pegIFN-α, pegylated IFN-alpha; PT, post-treatment; TNF-α, tumour necrosis factor-alpha; w, week.

Figure 4