. 2024 Jul 20;73(10):e332290. doi: 10.1136/gutjnl-2024-332290

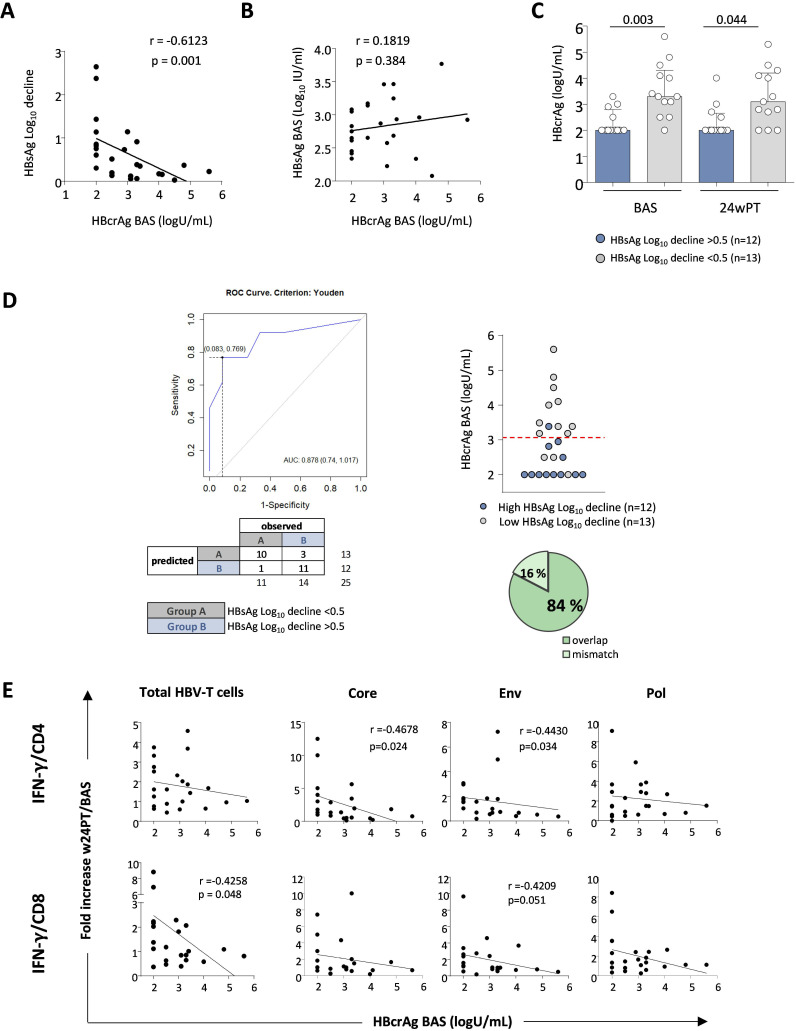
Figure 5. Predictive value of baseline HBcrAg levels on HBsAg decline and HBV-specific T cell responses. (A) Correlation between baseline HBcrAg levels and HBsAg log decline. (B) Correlation between baseline HBcrAg levels and baseline HBsAg values. (C) The columns indicate the median HBcrAg value at baseline and w24PT, while each dot shows individual patient HBcrAg values. (D) ROC analysis on segregated data derived from HBsAg log reduction values. Dotplot, confusion matrix and prediction accuracy are illustrated. (E) Correlation analyses between baseline HBcrAg values and quantity of IFN-γ-producing T cells specific for the whole HBV proteome (left charts) or specific for HBcore, HBenv and HBpol antigens (right charts) expressed as ratio between cytokine production by HBV-specific CD4 and CD8 T cells at w24PT and baseline for each patient following pegIFN-α add-on. Statistics by Spearman’s correlation test and Mann-Whitney test. As explained in the Methods section, HBcrAg values below 2.5 are indicated as 2 in all panels. AUC, area under the curve; BAS, baseline; Env, envelope; HBcrAg, hepatitis B core‐related antigen; HBsAg, hepatitis B surface antigen; IFN-γ, interferon-gamma; log10, logarithm base 10; pegIFN-α, pegylated IFN-alpha; Pol, polymerase; PT, post-treatment; ROC, receiver operating characteristic; w, week.

Figure 5