. 2024 Jul 20;73(10):e332290. doi: 10.1136/gutjnl-2024-332290

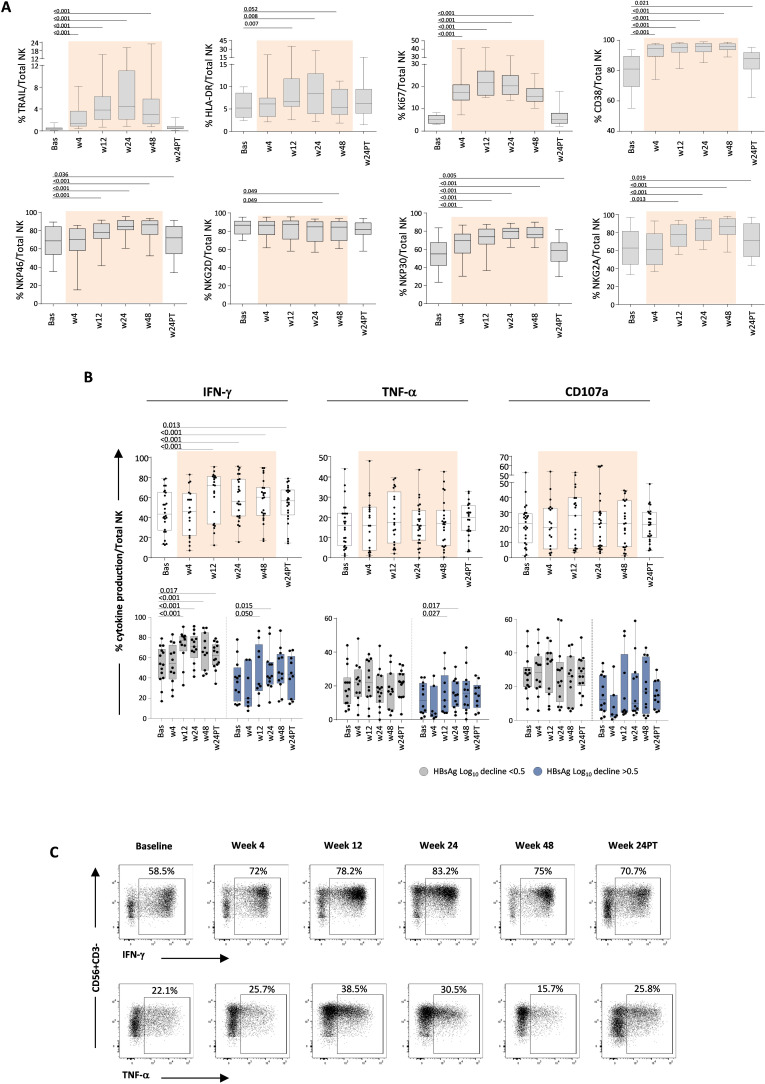
Figure 7. Effect of pegIFN-α therapy on NK cell phenotype and function. (A) Expression of TRAIL, HLA-DR, Ki67, CD38, NKp46, NKG2D, NKp30 and NKG2A on NK cells before, during and after pegIFN-α treatment (n=22). Results are expressed as median percentage of each NK cell phenotypical marker on total NK cells. (B) Analysis of NK cell IFN-γ, TNF-α production and CD107a degranulation capacity before, during and after pegIFN-α treatment (n=26, top panels) in the whole patient population and according to the different patient subgroups with different HBsAg log reductions (bottom panels); each whisker plot indicates the median values of NK cell functional parameters in the indicated time points. Statistics by the Kruskal-Wallis with Dunn’s correction test. (C) Representative plots of IFN-γ and TNF-α production by NK cells from a treated patient. Bas, baseline; HBsAg, hepatitis B surface antigen; IFN-γ, interferon-gamma; log10, logarithm base 10; NK, natural killer; pegIFN-α, pegylated IFN-alpha; PT, post-treatment; TNF-α, tumour necrosis factor-alpha; w, week.

Figure 7