
Figure 3.
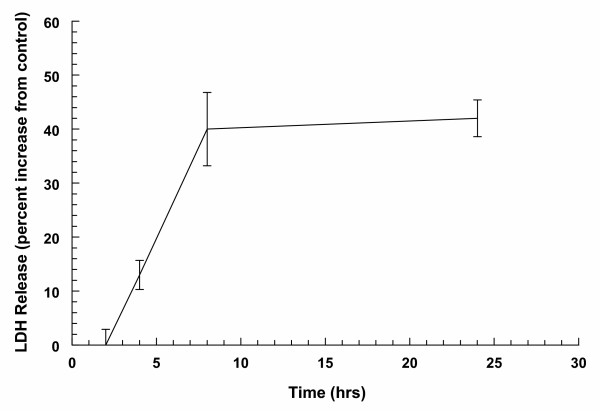
Kinetics of glutamate-induced cell death. Neuronal cells were maintained for 7 days in conditions similar to those described under Figure 1. Cells were treated with 200 μM glutamate for 20 mins. LDH release was measured at 2, 4, 8 and 24 hrs later. Results are expressed as percent LDH increase from control values. Each point is an average of 8 replicates. Error bars represent SEM.