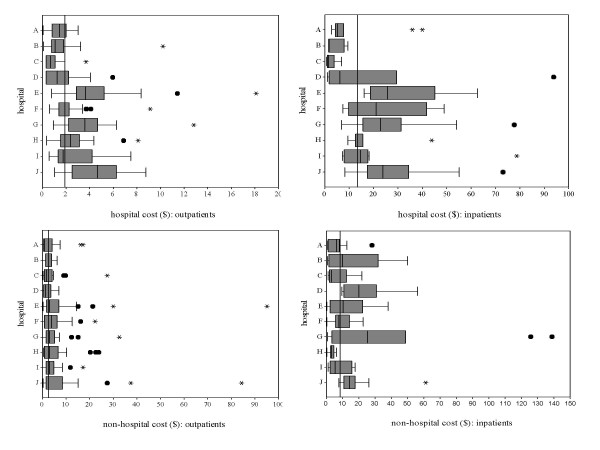
Figure 2.
Hospital and non-hospital cost borne by outpatients and inpatients. The limits of each box represent the 25th and 75th percentile values; whiskers represent the highest and lowest values excluding outliers; extreme values are shown as dots (1.5 to 3 times the box length) and asterisks (3 times or more the box length); vertical lines represent the median value in each hospital and overall.

