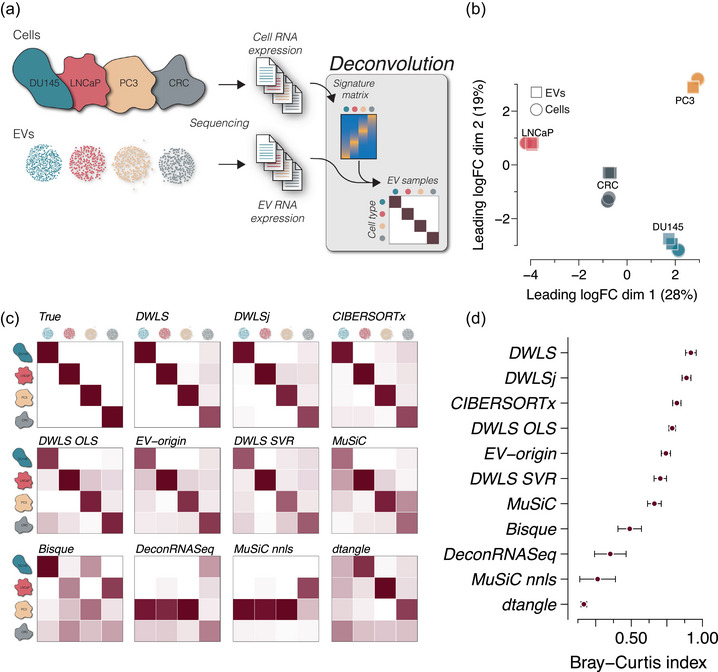
FIGURE 1.

Deconvolution accuracy across methods in pure EV samples from cell cultures. (a) Cell and EV RNA sequencing data from three prostate cancer cell lines DU145, LNCaP and PC3 (GSE183070) and a colorectal cancer (CRC, GSE121964) cell line (n = 3 cell and EV sample for each cell type). The cell RNA data was used to create a signature matrix for deconvolution of the cell‐derived EV RNA data. (b) Multidimensional scaling plot of the cell and EV samples showing cell type‐specific clustering. Circles indicate cells, and squares indicate EVs (n = 3 for each sample type). (c) Heatmaps of deconvolution results of the EV samples. The estimated EV abundance is the average of triplicates and is scaled between 0 and 1. The estimate for each sample is shown in Figure S1. The numbers are represented by the darkness of the colour, that is, 0 is white, and 1 is dark red. The upper left heatmap shows the true distribution. (d) Similarity to the true samples (upper left heatmap) is calculated as the Bray–Curtis index for all 12 samples, that is, four cell types and three replicates. The points indicate the mean Bray–Curtis index values and the error bars indicate SEM.
