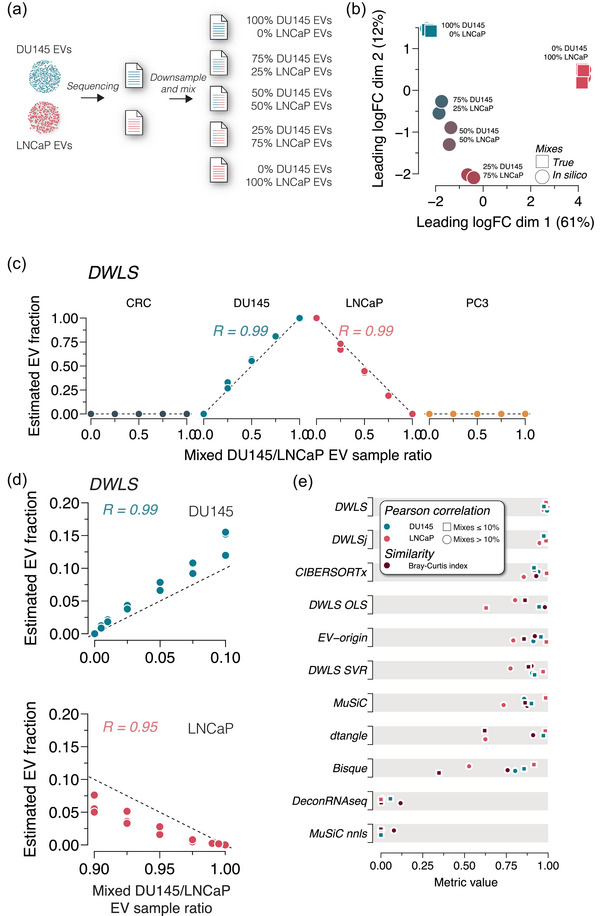
FIGURE 2.

Deconvolution accuracy across methods in mixed DU145 and LNCaP EV samples. (a) Raw RNA sequencing reads from DU145 and LNCaP EV samples were downsampled and mixed in ratios of 100:0, 75:25, 50:50, 25:75 and 0:100. All mixed files contained 30 million reads. (b) Multidimensional scaling plots of true (square) and in silico mixed (circle) RNA sequencing reads show ratio‐specific clustering (n = 3 for each ratio). (c) DWLS deconvolution of DU145 and LNCaP EV samples estimates the in silico mixing ratio accurately. R indicates the Pearson correlation coefficient. The deconvolution estimates with the remaining 10 methods are shown in Figure S5a. (d) Raw RNA sequencing reads from DU145 and LNCaP EV samples were downsampled and mixed in ratios of 0:100, 0.5:99.5, 1:99, 2.5:97.5, 5:95, 7.5:92.5, 10:90, 90:10, 92.5:7.5, 95:5, 97.5:2.5, 99:1, 99.5:0.5 and 100:0. DWLS convolution was most accurate in estimating the low abundance in silico mixing ratios of DU145 and LNCaP EVs. R indicates the Pearson correlation coefficient. The deconvolution estimates of the remaining 10 methods are shown in Figure S5b. (e) Summary of Pearson correlation coefficients and Bray–Curtis index for deconvolution of DU145 and LNCaP in silico mixed EV samples for the 11 transcriptome deconvolution methods. The metrics are colour‐coded, as indicated in the legend.
