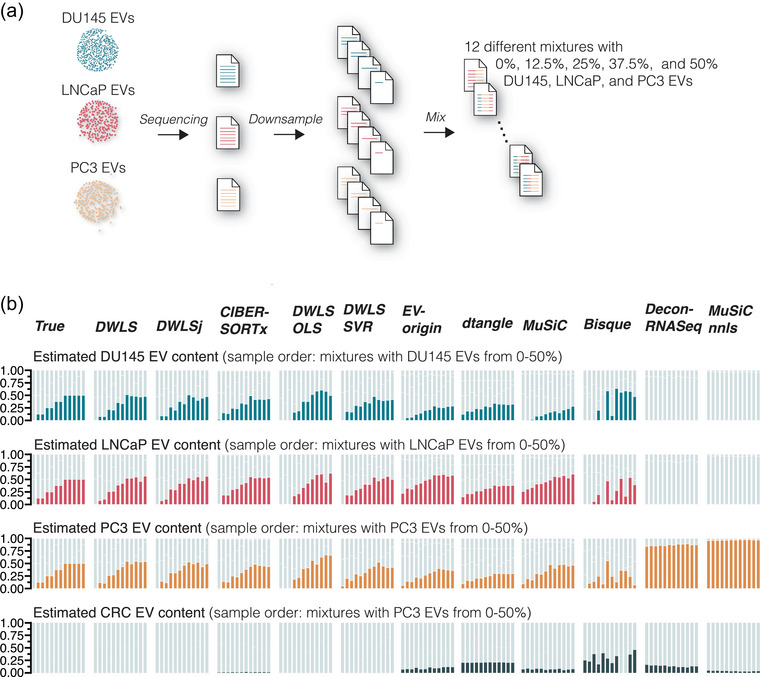
FIGURE 3.

Deconvolution accuracy of complex mixtures of DU145, LNCaP and PC3 EV samples. (a) Raw sequencing reads from DU145, LNCaP and PC3 EV samples were downsampled and mixed to yield 12 different samples with cell type‐specific EV content of 0%, 12.5%, 25%, 37.5% and 50%. (b) Compared to the true samples, DWLS, DWLSj, CIBERSORTx, DWLS OLS and DWLS SVR deconvolution methods accurately estimated the cell type‐specific EV content. The estimated EV abundance is the average of three in silico mixes. For visualization, the samples are ordered to show mixtures with an expected increase in the cell type‐specific EV content. Graphs with unsorted samples are shown in Figure S6.
