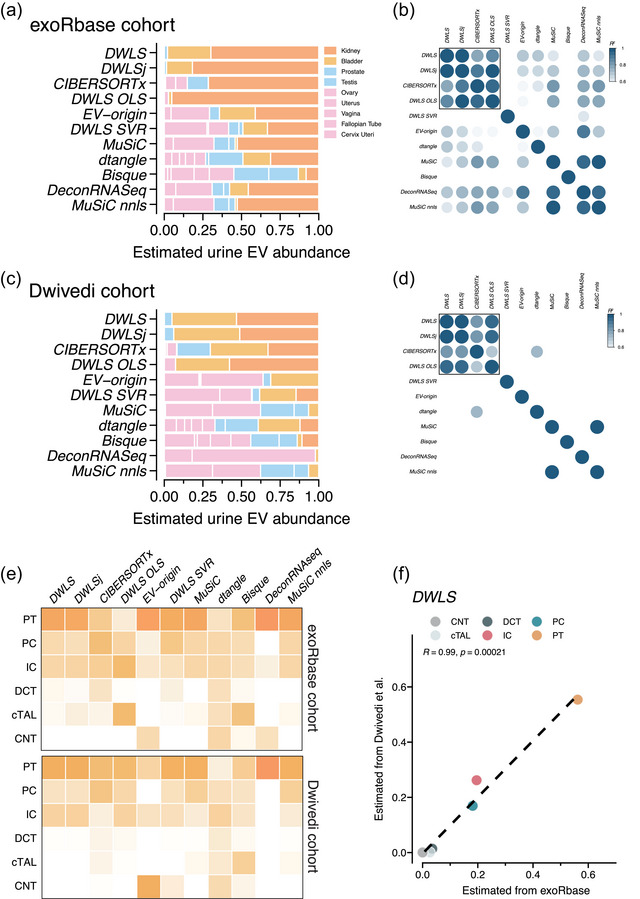
FIGURE 6.

Deconvolution of tissue‐ and kidney‐cell type‐specific EV abundances in urine across methods. (a) Deconvolution of urine EV samples from the exoRbase cohort (n = 16 samples) by the 11 deconvolution methods. The deconvolution methods’ estimated tissue/organ source is colour‐coded according to the legend. (b) Pearson correlation coefficients (R2 indicated by colour) between the 11 deconvolution methods’ estimates of tissue‐specific urine EV abundance. (c) Estimated tissue‐specific EV abundance and (d) Pearson correlation coefficients (R2 indicated by colour) between the 11 deconvolution methods’ estimates of the urine EVs from the Dwivedi et al. (2023) cohort (n = 72). (e) Heatmaps showing the estimated abundances of kidney epithelial cell type‐specific urine EV abundances in the exoRbase (top) and Dwivedi (bottom) cohorts by the 11 deconvolution methods. The estimated EV abundance is the average of all samples in the respective cohorts and is scaled between 0 and 1. The numbers are represented by the darkness of the colour, that is, 0 is white and 1 is dark orange. (f) Correlation between the DWLS method's deconvolution of urine samples from the exoRbase and Dwivedi cohorts. R indicates the Pearson correlation coefficient. The correlations for the remaining 10 deconvolution methods are shown in Figure S11. PT, proximal tubule; PC, principal cell; IC, intercalated cell; DCT, distal convoluted tubule; cTAL, cortical thick ascending limb of the loop of Henle's; CNT, connecting tubule.
