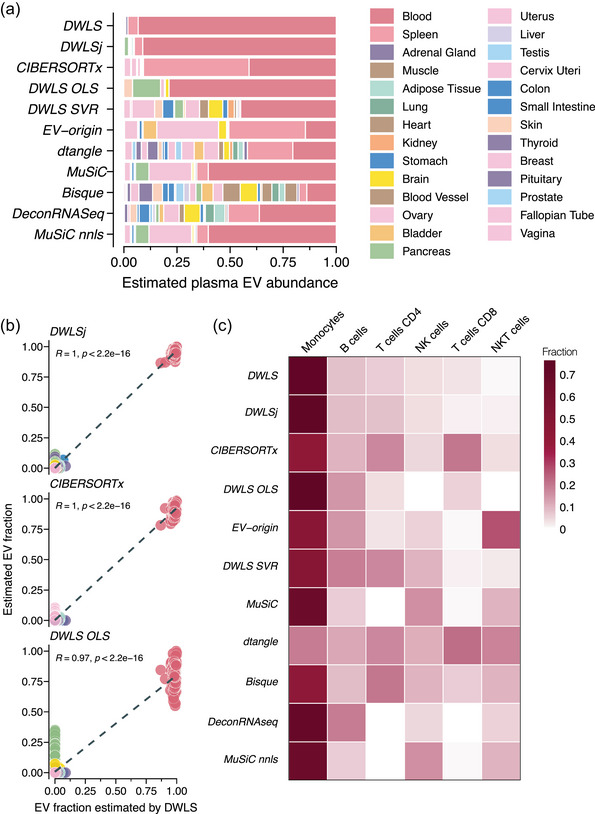
FIGURE 7.

Deconvolution of tissue‐specific EV abundances in plasma across methods. (a) Estimated tissue‐specific plasma EV abundance of plasma EV samples (n = 118, GEO accession numbers GSE100206 and GSE133684) by the 11 deconvolution methods. The tissues/organs are colour‐coded according to the legend. (b) Correlation between the individual person's tissue‐specific plasma EV abundance estimated by DLWS and (top panel) DWLSj, (middle panel) CIBERSORTx and (bottom panel) DWLS OLS. R indicates the Pearson correlation coefficient. (c) Heatmap showing the estimated abundances of peripheral blood mononuclear cells‐derived plasma EVs by the 11 deconvolution methods. The estimated EV abundance is the average of all samples in the cohorts and is scaled between 0 and 1. The numbers are represented by the darkness of the colour, that is, 0 is white and 1 is dark red. The correlation between the 11 deconvolution methods estimates is shown in Figure S13.
