

Abstract
Background
In humans with pheochromocytomas (PCCs), targeted metabolomics is used to determine the catecholamine phenotype or to uncover underlying pathogenic variants in tricarboxylic acid (TCA) cycle genes such as succinate dehydrogenase subunits (SDHx).
Hypothesis/Objectives
To analyze catecholamine contents and TCA cycle metabolites of PCCs and normal adrenals (NAs).
Animals
Ten healthy dogs, 21 dogs with PCC.
Methods
Prospective observational study. Dogs diagnosed with PCC based on histopathological and immunohistochemical confirmation were included. Tissue catecholamine contents and TCA metabolites in PCCs and NAs were measured by liquid chromatography with mass spectrometry or electrochemical detection.
Results
Compared to NAs, PCCs had significantly higher tissue proportion of norepinephrine (88% [median: range, 38%‐98%] vs 14% [11%‐26%]; P < .001), and significantly lower tissue proportion of epinephrine (12% [1%‐62%] vs 86% [74%‐89%]; P < .001). Pheochromocytomas exhibited significantly lower fumarate (0.4‐fold; P < .001), and malate (0.5‐fold; P = .008) contents than NAs. Citrate was significantly higher in PCCs than in NAs (1.6‐fold; P = .015). One dog in the PCC group had an aberrant succinate : fumarate ratio that was 25‐fold higher than in the other PCCs, suggesting an SDHx mutation.
Conclusions and Clinical Importance
This study reveals a distinct catecholamine content and TCA cycle metabolite profile in PCCs. Metabolite profiling might be used to uncover underlying pathogenic variants in TCA cycle genes in dogs.
Keywords: adrenal, dog, Krebs cycle, PNMT, succinate dehydrogenase
Abbreviations
- BSA
bovine serum albumin
- CHGA
chromogranin A
- CYP11B
cytochrome P450 family 11 subfamily B
- CYP17A1
cytochrome P450 family 17 subfamily A member 1
- FH
fumarate hydratase
- GAPDH
glyceraldehyde‐3‐phosphate dehydrogenase
- HNRPH
heterogeneous nuclear ribonucleoprotein H
- IDH
isocitrate dehydrogenase
- LC‐MS/MS
liquid chromatography‐tandem mass spectrometry
- mRNA
messenger ribonucleic acid
- NA
normal adrenal
- PCC
pheochromocytoma
- pMN
plasma free metanephrine
- pNMN
plasma free normetanephrine
- PNMT
phenylethanolamine‐N‐methyltransferase
- RPS5
ribosomal protein S5
- SDHx
succinate dehydrogenase subunits
- STAR
steroidogenic acute regulatory protein
- TBST 0.1%
Tris‐buffered saline with 0.1% Tween
- TCA
tricarboxylic acid
- TH
tyrosine hydroxylase
1. INTRODUCTION
Pheochromocytomas (PCCs) are neural crest‐derived neuroendocrine tumors arising from chromaffin cells of the adrenal medulla. When biochemically functional, they secrete excessive amounts of catecholamines, resulting in a variety of clinical signs, including potentially life‐threatening cardiovascular complications. 1 Diagnosis primarily relies on diagnostic imaging and biochemical testing, involving the measurement of plasma or urinary metanephrines. 1 , 2 In humans, PCCs are linked to mutations in various genes, including those involved in the tricarboxylic acid (TCA) cycle. 3 Notably, mutations in succinate dehydrogenase subunits (SDHx), fumarate hydratase (FH), and isocitrate dehydrogenase (IDH) result in the accumulation of succinate, fumarate, and 2‐hydroxyglutarate, respectively. These metabolites drive tumor formation and progression. 4 , 5 The identification and quantification of these metabolites in tumor tissue provide insights into underlying pathogenic variants in TCA cycle genes. 6 , 7 , 8 , 9 Detection of tumors associated with SDHx and FH mutations is important for patient care and follow‐up, as these tumors exhibit a more aggressive, pro‐metastatic behavior. 6 , 8 Additionally, targeted metabolomics can help determine the catecholamine phenotype, offering valuable clues to potential underlying mutations and providing insight to the pathogenesis of these tumors. 10 , 11 Moreover, metabolomic information from PCCs might offer clues for potential treatment targets. 5 , 8
In dogs, there have been no metabolomic studies of PCCs or normal adrenal tissues. Although mutations in genes encoding subunits of SDH were identified in canine PCCs, 12 , 13 the pathogenicity of these variants has not been proven by functional studies. In addition, the catecholamine phenotype has not been assessed in canine PCCs. Metabolomics might provide new insights into the pathophysiological processes involved and could improve the diagnosis, and perhaps even treatment, of this disease.
Our aim was to explore the metabolomic profile of canine PCCs and normal adrenals by assessing the tissue catecholamine and TCA cycle metabolite concentrations to define phenotypic differences, and to screen for alterations in key metabolites indicative of TCA cycle aberrations.
2. MATERIALS AND METHODS
2.1. Cohort and sample collection
Tumor tissue was obtained from 21 client‐owned dogs with PCCs after surgical removal or immediately after euthanasia. A representative piece of the tumor was either snap‐frozen in liquid nitrogen or initially preserved in RNAlater stabilization solution (Invitrogen, ThermoFisher Scientific, Breda, the Netherlands) and then stored at −70°C until further processing. Normal adrenals were obtained from healthy dogs euthanized for reasons unrelated to the present study, which was approved by the Ethical Committee of Utrecht University. After resection, fat surrounding NAs was carefully dissected, and NAs were immediately snap‐frozen and stored at −70°C. Tumor tissue was stored for 14 to 4065 days (median 885 days), while normal adrenals were stored for 1658 to 3135 days (median 1735 days).
For all PCC cases, diagnosis was confirmed through histopathology and immunohistochemistry using the adrenomedullary markers chromogranin A (CHGA) and synaptophysin, as described. 14 When available, plasma free metanephrines (normetanephrine [pNMN] and metanephrine [pMN]) were also recorded. Concentrations of pNMN and pMN were analyzed by liquid chromatography‐tandem mass spectrometry (LC‐MS/MS). Pheochromocytomas were defined as biochemically negative when plasma metanephrines were not above their upper reference limits. 15 The upper reference limits (ie, 3.56 nmol/L for pNMN and 2.49 nmol/L for pMN) were obtained from published reference intervals for plasma free metanephrines in healthy dogs. 16
2.2. Sample preparation procedure
Tissue samples for catecholamine and TCA cycle metabolite measurements were prepared as previously described using the cell disruption buffer of the Paris Kit (AM1921, ThermoFisher Scientific). 17 The resulting lysates were also used for sodium dodecyl‐sulfate polyacrylamide gel electrophoresis (SDS‐PAGE) and Western blot analysis. RNA of the same sample specimens was isolated after the RNA isolation procedure of the Paris Kit (ThermoFisher Scientific).
2.3. Tissue catecholamine measurements
Tissue concentrations of catecholamines (norepinephrine, epinephrine, and dopamine) and the catecholamine precursor dihydroxyphenylalanine (L‐DOPA) were determined by liquid chromatography with electrochemical detection as described. 18 Absolute concentrations of catecholamines were calculated relative to tissue sample weight. Relative concentrations of norepinephrine, epinephrine, and dopamine were determined by comparing each catecholamine's concentration to the total tissue concentration of catecholamines, which is the sum of norepinephrine, epinephrine, and dopamine.
2.4. Normalization of catecholamine content in NAs
To correct for differences in composition (ie, percentage of adrenal medulla and adrenal cortex) among NA samples, reverse transcription‐quantitative PCR analyses were performed to determine and compare the expression levels of adrenomedullary markers CHGA, phenylethanolamine‐N‐methyltransferase (PNMT), and tyrosine hydroxylase (TH), and of adrenocortical markers steroidogenic acute regulatory protein (STAR), cytochrome P450 family 17 subfamily A member 1 (CYP17A1), and cytochrome P450 family 11 subfamily B (CYP11B). The messenger ribonucleic acid (mRNA) and genomic sequences for all target genes were obtained from the NCBI GenBank database. Based on these sequences, primer sets (Table S1) were designed by PerlPrimer version 1.1.21 19 according to the parameters in the Bio‐Rad iCycler manual (Veenendaal, the Netherlands), checked for formation of secondary structures with mFold web server (http://www.unafold.org/mfold/applications/dna-folding-form.php), 20 and ordered from Eurogentec (Maastricht, the Netherlands). Optimization and confirmation of primer specificity of the PCR were performed as previously described. 21 To correct for differences in cDNA concentrations, heterogeneous nuclear ribonucleoprotein H (HNRPH), glyceraldehyde‐3‐phosphate dehydrogenase (GAPDH), and ribosomal protein S5 (RPS5) were used as reference genes. The geNorm method was used to analyze the pairwise variance and stability of reference gene expression, which justified their use. 22 RNA purity was verified with a NanoDrop ND‐1000 Spectrophotometer (ThermoFisher Scientific). Only samples meeting the criterion of a 260/280 ratio within the acceptable range (1.8‐2.2) were included for qPCR analysis. Calculation of normalized relative mRNA expression levels of the target genes was performed by the 2−ΔΔCt method. 23 The percentage of adrenal medulla was estimated as follows: ([2−ΔΔCt,CHGA + 2−ΔΔCt,PNMT + 2−ΔΔCt,TH]/3)/(([2−ΔΔCt,CHGA + 2−ΔΔCt,PNMT + 2−ΔΔCt,TH]/3) + ([2−ΔΔCt,STAR + 2−ΔΔCt,CYP17A1 + 2−ΔΔCt,CYP11B]/3)) × 100%. Based on this, the absolute and relative tissue catecholamine concentrations of NAs were corrected so that a value corresponding with 100% medulla was used for the comparison between PCCs and NAs.
2.5. Classification of catecholamine phenotype
The classification of tumor catecholamine phenotypes was based on the tissue epinephrine content expressed as a percentage of both epinephrine and norepinephrine, as previously described for human PCCs. 10 Epinephrine‐producing tumors (adrenergic phenotype) are characterized by an epinephrine content >10%, while norepinephrine‐producing tumors (noradrenergic phenotype) exhibit an epinephrine content <10%.
2.6. SDS‐PAGE and Western blot analysis for PNMT
In a subset of PCCs, Western blot analysis for PNMT was performed to quantify the PNMT protein expression among the different tumors. Recombinant human PNMT protein (AB89368, Abcam, Cambridge, UK) was used as a positive control, as well as canine adrenal tissue and canine adrenal medulla. The DC Protein Assay (BioRad, Veenendaal, the Netherlands) was used to measure total protein concentrations. Subsequently, approximately 80 μg protein homogenate was supplemented with phosphate‐buffered saline to a volume of 24 μL. Next, 8 μL of 4× Laemmli Sample Buffer with dithiothreitol (BioRad) was mixed with each of the samples, and mixtures were heated at 95°C for 2 minutes to denature the proteins. Then, 32 μL of the samples or 10 μL of the Precision Plus Protein Standard (BioRad) was loaded onto a 10% Criterion TGX Precast Midi Protein Gel (BioRad), followed by gel‐electrophoresis.
After gel‐electrophoresis, the gel was blotted onto a nitrocellulose membrane (BioRad). The membrane underwent a 60‐minute blocking step in Tris‐buffered saline with 0.1% Tween (TBST 0.1%) containing 4% ECL Blocking Agent (Amersham, GE Healthcare, Diegem, Belgium) and 4% bovine serum albumin (BSA, Sigma‐Aldrich, Amsterdam, the Netherlands). Subsequently, it was incubated overnight at 4°C with the anti‐PNMT antibody (AB154282, Abcam) at a 1 : 1000 dilution in 4% BSA in TBST 0.1%.
On the next day, the membrane was incubated with a goat anti‐rabbit horseradish peroxidase conjugated secondary antibody (HAF008, Bio‐Techne, Dublin, Ireland) at a 1 : 20 000 dilution in TBST 0.1% with 4% BSA for 60 minutes. All washing steps were carried out with TBST 0.1%. Protein visualization was accomplished using an ECL advanced Western blotting detection kit (Amersham), and the resulting chemiluminescence was detected utilizing a ChemiDoc XRS Chemi Luminescent Image Capture system (BioRad).
Actin was used as a loading control. After blocking of the nitrocellulose membrane, the membrane was cut horizontally using a prestained marker (Precision Plus Protein Standard) and it was incubated overnight at 4°C with the anti‐Actin antibody (MS‐1295‐P1, ThermoFisher Scientific, Breda, the Netherlands) at a 1 : 2000 dilution in 4% BSA in TBST 0.1%. The next day, the membrane was incubated for 60 minutes with a goat anti‐mouse horseradish peroxidase conjugated secondary antibody (HAF007, Bio‐Techne) at a 1 : 20 000 dilution. The remainder of the protocol was performed as described above.
Band intensities were quantified by ImageJ software. 24 Phenylethanolamine‐N‐methyltransferase expression was normalized to loading control and compared across samples.
2.7. TCA cycle metabolites
Eight organic acids of the TCA cycle (citrate, cis‐aconitate, isocitrate, α‐ketoglutarate, succinate, fumarate, malate, 2‐hydroxyglutarate) as well as lactate were determined by LC‐MS/MS, along with the amino acids glutamate, glutamine, aspartate, and asparagine, as previously described for human tissues. 6 Samples with potential contaminants (eg, those stored in RNA‐preserving citrate‐based buffers such as RNAlater 6 ) were excluded from analyses of the metabolites citrate, cis‐aconitate, and isocitrate. Concentrations of TCA cycle metabolites were calculated relative to tissue sample weight.
2.8. Statistical analysis
Data analysis was performed by the statistical software program IBM SPSS Statistics for Windows, version 27 (IBM Corp., Armonk, NY, USA). Data were assessed for normality of distribution by the Shapiro‐Wilk test. Differences in results between 2 groups were assessed by the independent samples t‐test or Mann‐Whitney U‐test. For the dogs with PCCs, a nonparametric correlation analysis (Spearman's rank correlation coefficient) was used to calculate the correlation between plasma free metanephrines and absolute or relative tissue concentrations of catecholamines. Outlier analysis on ln‐transformed values was used to identify PCCs with aberrant succinate : fumarate ratios, fumarate : malate ratios, or 2‐hydroxyglutarate concentrations. We focused on extreme outliers (ie, outliers above the third quartile +3‐times the interquartile range). Values were considered significant at P < .05.
3. RESULTS
3.1. Study group
Of the 21 dogs with PCC, 12 dogs were male (6 neutered, 6 intact) and 9 were female (all neutered). Median age at the time of surgery or euthanasia was 11.7 years (range, 1.7‐14 years). Breeds included 3 Jack Russell Terriers, 3 mixed breeds, 2 Galgo Españols, 2 Pugs, and 1 each of Shih Tzu, Rhodesian Ridgeback, Cairn Terrier, Yorkshire Terrier, Irish Setter, Irish Soft‐coated Wheaten Terrier, Chihuahua, Labradoodle, Australian Cattle Dog, German Shepherd, and Staffordshire Bull Terrier.
Of the 10 healthy dogs from which NAs were obtained, 9 were female (all intact) and 1 was male (intact). The median age at the time of euthanasia was 1.5 years (range, 1.0‐3.1 years). The breeds included 9 mixed breeds and 1 Beagle. Healthy dogs were significantly younger than dogs with PCC (P < .001).
3.2. Comparison of tissue catecholamines in PCCs and NAs
Absolute tissue contents of catecholamines showed considerable variability among PCCs and NAs. Epinephrine was significantly higher in NAs than in PCCs (P < .001), whereas norepinephrine and dopamine showed no significant differences (Table 1 and Figure 1). L‐DOPA was significantly higher in PCCs than in NAs (P = .003; Table 1 and Figure 1). Regarding relative tissue proportions, epinephrine was significantly higher in NAs (P < .001), while norepinephrine was significantly higher in PCCs (P < .001; Table 2 and Figure 2). In addition, the relative tissue proportion of dopamine was significantly higher in PCCs than in NAs (P < .001; Table 2 and Figure 2).
TABLE 1.
Absolute tissue conentrations of catecholamines in PCCs and NAs.
| PCC | NA | |
|---|---|---|
| Norepinephrine (ng/mg tissue) | 2767 (0.25‐12 699) | 344 (146‐775) |
| Epinephrine (ng/mg tissue) | 155 (0.07‐2714) | 2320 (922‐4603)* |
| Dopamine (ng/mg tissue) | 37.2 (0.007‐183) | 5.3 (3.3‐13.4) |
| Dihydroxyphenylalanine (ng/mg tissue) | 2.23 (0.04‐18.9) | 0.25 (0.10‐0.90)* |
Note: Values are expressed as median (range).
Abbreviations: NA, normal adrenal; PCC, pheochromocytoma.
Statistically significant difference (P < .05) between PCC and NA.
FIGURE 1.
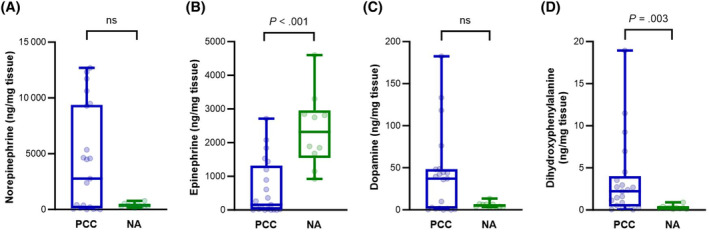
Boxplots comparing absolute tissue concentrations of norepinephrine (A), epinephrine (B), dopamine (C), and dihydroxyphenylalanine (D) in PCCs and NAs. Boxes span the interquartile range (ie, the second and third quartiles). The line within the box represents the median. The whiskers represent the minimum and maximum values. Individual values are represented by the dots. Y‐axes indicate tissue levels of catecholamines in ng/mg tissue. Significance was established by the Mann‐Whitney U‐test. NA, normal adrenal; ns, nonsignificant; PCC, pheochromocytoma.
TABLE 2.
Relative tissue proportions of catecholamines in PCCs and NAs.
| PCC | NA | |
|---|---|---|
| Norepinephrine (%) | 87.8 (37.7‐98.5) | 14.1 (11.1‐25.5)* |
| Epinephrine (%) | 11.5 (1.0‐61.9) | 85.8 (74.2‐88.5)* |
| Dopamine (%) | 0.73 (0.28‐5.6) | 0.21 (0.11‐0.40)* |
Note: Values are expressed as median (range).
Abbreviations: NA, normal adrenal; PCC, pheochromocytoma.
Statistically significant difference (P < .05) between PCC and NA.
FIGURE 2.
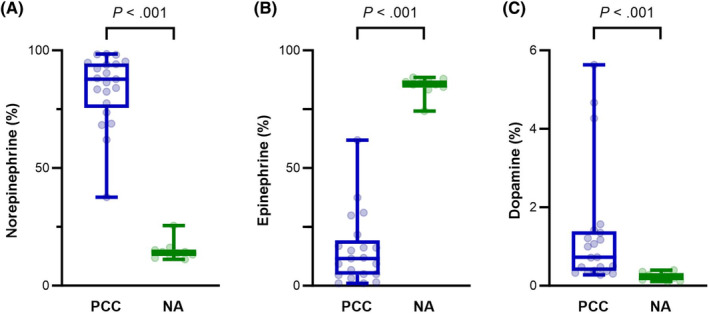
Boxplots comparing relative tissue proportions of norepinephrine (A), epinephrine (B), and dopamine (C) in PCCs and NAs. Boxes span the interquartile range. The line within the box represents the median. The whiskers represent the minimum and maximum values, while individual values are represented by the dots. Y‐axes indicate the relative tissue proportion of catecholamines. Significance was established by the Mann‐Whitney U‐test. NA, normal adrenal; PCC, pheochromocytoma.
3.3. Correlation tissue catecholamines and plasma free metanephrines
Plasma free metanephrines were available in 18 dogs with PCC. A moderate, positive correlation was found between absolute epinephrine tissue concentration and pMN (rho = 0.61, P = .008, 95% confidence interval, 0.18‐0.84). There were no significant correlations between absolute norepinephrine tissue concentration and pNMN or relative tissue proportions of catecholamines and plasma free metanephrines.
3.4. Tissue catecholamines and biochemical phenotype of PCCs
Three PCCs were categorized as biochemically negative because the plasma metanephrines of these dogs did not exceed the upper reference limits. Compared to tumors of dogs with plasma metanephrines above the reference range, these 3 tumors had significantly lower absolute tumor tissue concentrations of norepinephrine (P = .027), epinephrine (P = .010), and dopamine (P = .017).
3.5. Catecholamine phenotype of PCCs
Based on tumor catecholamine contents, 11 PCCs were classified as epinephrine‐producing (adrenergic phenotype) and 10 as norepinephrine‐producing (noradrenergic phenotype) tumors. There were no significant differences in plasma metanephrines or any of the TCA cycle metabolites between epinephrine‐producing and norepinephrine‐producing tumors.
3.6. PNMT expression in canine PCCs
SDS‐PAGE and Western blot analysis revealed a prominent band at approximately 31 kDa, corresponding to the expected molecular weight of PNMT, in all positive control lanes (human recombinant PNMT, canine adrenal tissue lysate, and canine adrenal medulla). This finding confirms the suitability of the anti‐PNMT antibody for use in dogs. In the subset of 8 PCC samples analyzed, 1 sample (PCC 1) exhibited a strong band intensity, another (PCC 5) showed moderate to weak intensity (89% lower than PCC 1), and a third (PCC 8) displayed weak intensity (92% and 24% lower than PCC 1 and PCC 5, respectively; Figure 3). The relative tissue concentration of epinephrine was highest for PCC 1 (62%), followed by PCC 5 (30%) and PCC 8 (7%). The remaining 5 PCC samples did not show a band for PNMT. All of these samples had relative epinephrine contents ≤5%, except for 1 sample (PCC 7), which exhibited an epinephrine content of 17%.
FIGURE 3.
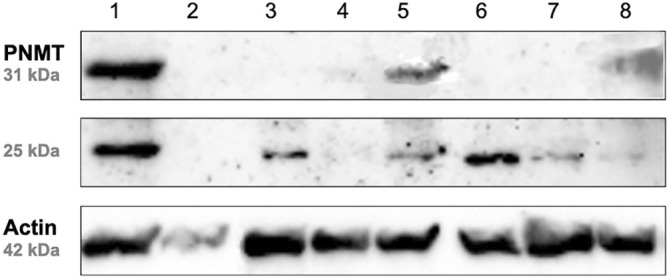
Western blot analysis of 8 PCC samples (labeled 1‐8) demonstrating the expression of PNMT relative to Actin as a reference protein. The signal for PNMT was apparent at approximately 31 kDa. In 6 out of 8 PCCs, an additional band of varying intensity at 25 kDa was detected. PCC, pheochromocytoma; PNMT, phenylethanolamine‐N‐methyltransferase.
In 6 out of 8 PCCs, SDS‐PAGE and Western blot analysis for PNMT revealed an additional band at 25 kDa, absent in normal canine adrenal tissue or canine adrenal medullary tissue (Figure 3).
3.7. TCA cycle metabolites
Figure 4 and Table 3 show the differences in TCA cycle metabolites between PCCs and NAs. Compared to NAs, PCCs had significantly lower fumarate (0.4‐fold; P < .001) and malate (0.5‐fold; P = .008) contents. Citrate was significantly higher in PCCs compared to NAs (1.6‐fold; P = .015). No significant differences between the 2 groups were found for cis‐aconitate, isocitrate, α‐ketoglutarate, succinate, and lactate. Regarding the 4 amino acids, PCCs had significantly lower glutamate (0.4‐fold; P = .028), asparagine (0.6‐fold; P = .004), and glutamine (0.4‐fold; P < .001) than NAs, while there was no significant difference for aspartate.
FIGURE 4.
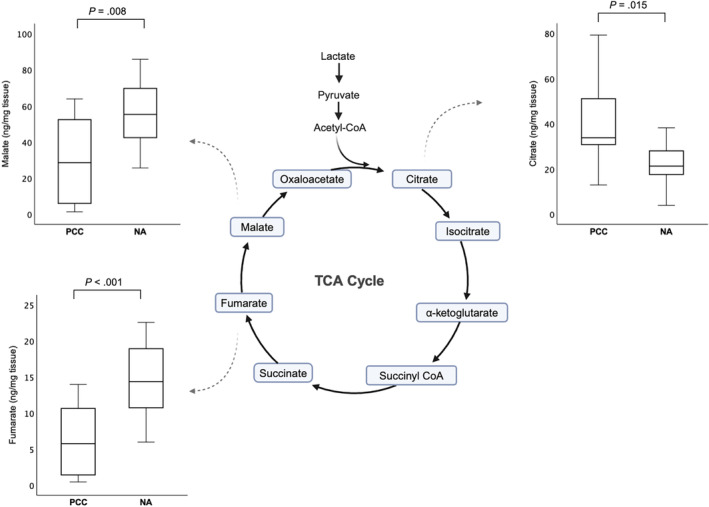
Boxplots comparing TCA cycle metabolite levels between PCCs and NAs that were significantly different. Boxes span the interquartile range. The line within the box represents the median. The whiskers represent the range, extending to a maximum of 1.5‐times the interquartile range. Y‐axes indicate tissue levels of metabolites in ng/mg tissue. Significance was established by the independent samples t‐test or Mann‐Whitney U‐test. NA, normal adrenal; PCC, pheochromocytoma; TCA, tricarboxylic acid.
TABLE 3.
Tissue concentrations of TCA metabolites in PCCs and NAs.
| PCC | NA | |
|---|---|---|
| Citrate (ng/mg tissue) | 33.8 (12.9‐79.2) | 21.3 (3.91‐38.2)* |
| Cis‐aconitate (ng/mg tissue) | 5.93 (0.69‐213) | 2.74 (0.23‐4.20) |
| Isocitrate (ng/mg tissue) | 10.7 (1.54‐725) | 6.46 (0.44‐13.8) |
| α‐Ketoglutarate (ng/mg tissue) | 0.87 (0.10‐20.9) | 1.09 (0.40‐2.02) |
| Succinate (ng/mg tissue) | 23.4 (2.38‐155) | 38.0 (12.5‐75.7) |
| Fumarate (ng/mg tissue) | 5.77 (0.46‐14.0) | 14.4 (5.98‐22.6)* |
| Malate (ng/mg tissue) | 28.6 (1.36‐63.8) | 55.3 (25.6‐85.8)* |
| 2‐Hydroxyglutarate (ng/mg tissue) | 0.33 (0.05‐35.8) | 0.76 (0.34‐1.15) |
| Lactate (ng/mg tissue) | 615 (37.2‐2584) | 561 (260‐752) |
Note: Values are expressed as median (range).
Abbreviations: NA, normal adrenal; PCC, pheochromocytoma.
Statistically significant difference (P < .05) between PCC and NA.
3.8. Succinate : fumarate ratio, fumarate : malate ratio, and 2‐hydroxyglutarate concentrations
The succinate : fumarate ratio was significantly higher in PCCs than in NAs (1.7‐fold; P = .012), while the fumarate : malate ratio was significantly lower in PCCs (0.8‐fold; P = .004). There was no significant difference in 2‐hydroxyglutarate concentrations between PCCs and NAs.
Outlier analysis detected 1 dog in the PCC group with an aberrant succinate : fumarate ratio, which was 25‐fold higher than in the other PCCs (Figure 5), suggestive of an underlying SDHx mutation. In this sample, succinate concentrations were 8‐fold higher than in the other PCCs, whereas citrate, cis‐aconitate, isocitrate, α‐ketoglutarate, fumarate, and malate were, respectively, 65%, 6%, 58%, 16%, 74%, and 77% lower. In addition, this sample had lower aspartate (31%) and glutamine (16%), and higher glutamate (56%) and asparagine (137%) compared to the other PCCs.
FIGURE 5.
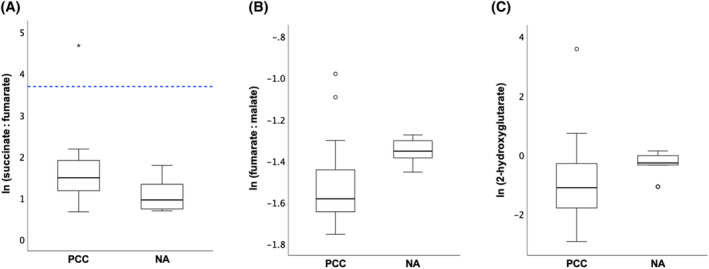
Boxplots of the ln‐transformed succinate : fumarate ratio (A), fumarate : malate ratio (B), and 2‐hydroxyglutarate levels (C) for PCCs and NAs. The box represents the interquartile range. The line within the box represents the median. The whiskers represent the range, extending to a maximum of 1.5‐times the interquartile range. Circles represent outliers that fall above the third quartile +1.5‐times the interquartile range or below the first quartile −1.5‐times the interquartile range, while asterisks represent extreme outliers exceeding the third quartile +3‐times the interquartile range or falling below the first quartile −3‐times the interquartile range. The cutoff for the succinate : fumarate ratio, as previously defined for humans with this extraction method, 8 is marked by the blue dotted line. ln, natural logarithm; NA, normal adrenal; PCC, pheochromocytoma.
No extreme outliers with a high fumarate : malate ratio or high 2‐hydroxyglutarate levels were identified (Figure 5).
4. DISCUSSION
This study reports on tissue metabolomics in canine PCCs and NAs, revealing a distinct catecholamine content and TCA cycle metabolite profile in PCCs. In addition, we identified a dog with a suspected SDHx mutation based on a high tumor succinate : fumarate ratio, suggesting that metabolite profiling can be used to uncover underlying pathogenic variants in TCA cycle genes in dogs.
Norepinephrine constituted the major portion of catecholamine content in PCCs, while in NAs, the predominant component was epinephrine. In NAs, the median epinephrine proportion of 86%, as observed in the present study, is largely consistent with prior reports indicating that approximately 70% of the total catecholamine proportion in the canine adrenal medulla consists of epinephrine. 25 It is important to note that the normalization for the catecholamine content of NAs was based on quantitative PCR analysis in our study, which might not accurately reflect the true composition at the protein level. Lower expression of PNMT, the enzyme responsible for converting norepinephrine to epinephrine, could explain the significantly lower epinephrine content in PCCs. In humans, a lower PNMT expression occurs both on the mRNA and protein levels in PCCs compared to normal adrenal medullas. 26 , 27 Similar results are found in dogs on the mRNA level, 14 although the investigation on the protein level has not been conducted in dogs. The higher norepinephrine content in PCCs could indicate that the more poorly differentiated, noradrenergic chromaffin cells are more prone to tumorigenesis. Alternatively, PCCs might exhibit an increased secretion rate of epinephrine, but not norepinephrine, compared to NAs. However, this seems unlikely, as both epinephrine and norepinephrine are subject to the same cellular regulatory controls for secretion. 2
In our study, healthy dogs were significantly younger than PCC dogs. Earlier literature describes that aged female rats (>22 months, compared to 2‐month‐old animals) exhibited increases in epinephrine content, whereas catecholamine contents of male rats remained unaltered with aging. 28 In contrast, epinephrine content decreased with aging in male mice (24‐month‐old mice, compared to 6‐ and 12‐month‐old mice). 29 Age‐related changes in catecholamine content have been studied in puppies vs adult dogs, which found a relative norepinephrine content of 64% (52%‐74%) in dogs 2 to 7 days old, 47% (26%‐52%) in dogs 20 to 30 days old, and 18.5% (7%‐21%) in adult dogs. 30 Unfortunately, there are no studies on age‐related changes in catecholamine content in older dogs, but this might contribute to the observed differences between NAs and PCCs.
In humans, the categorization of tumor catecholamine phenotypes relies on the tissue epinephrine content expressed as a percentage of both epinephrine and norepinephrine. Adrenergic tumors display an epinephrine content exceeding 10%, whereas noradrenergic tumors exhibit an epinephrine content below 10%. 10 This catecholamine phenotype can depend on underlying mutations, with patients with SDHx mutations having an almost exclusively noradrenergic phenotype, while patients with mutations in kinase signaling pathways nearly all having an adrenergic phenotype. 2 , 10 Applying this categorization to our dogs classified 11 PCCs as adrenergic and 10 as noradrenergic. Unfortunately, genetic characterization was not conducted in these dogs, impeding analyses of the relationship between catecholamine phenotype and genotype. Nevertheless, the dog suspected of an SDHx mutation exhibited a noradrenergic phenotype, aligning with findings in humans. 2 , 10
The adrenergic and noradrenergic catecholamine phenotype might suggest distinct cellular origins for these tumors, derived either from immature noradrenergic chromaffin cell progenitors or from more highly differentiated adrenergic chromaffin cells of the adult adrenal medulla. 10 , 11 Alternatively, activated signaling pathways in these tumors might influence expression of PNMT. 11 For example, hypoxia‐inducible factor 2α, which is upregulated in pseudohypoxic PCCs, blocks the induction of PNMT and is thus associated with a noradrenergic catecholamine phenotype. 31 Further research is warranted to delve deeper into the molecular mechanisms underlying these adrenergic and noradrenergic phenotypic differences and to explore potential therapeutic or prognostic implications.
In human medicine, measurement of plasma free metanephrines can be used to predict tumor catecholamine phenotype. 10 , 11 An increase in pMN exceeding 10% of the combined increases of pNMN and pMN effectively detects the majority of adrenergic tumors, whereas an increase of less than 5% is valuable for identifying noradrenergic tumors. 10 , 11 In our dogs, however, the increase in pMN well exceeded this 5% in all noradrenergic tumors. Consequently, these cutoffs for plasma free metanephrines cannot be easily translated for use in dogs for predicting the catecholamine phenotype.
Future large‐scale studies are necessary to explore whether distinct patterns in plasma metanephrines, or perhaps even other diagnostic biomarkers, can accurately predict the catecholamine phenotypes in dogs.
Three dogs were classified as having biochemically negative PCCs. Negative test results for measurements of plasma metanephrines could reflect lack of diagnostic sensitivity (either test‐dependent or because of small tumor size) or could indicate a nonfunctional tumor. 15 Based on the catecholamine contents of these tumors, which were significantly lower in biochemically negative PCCs, the negative test results seem to reflect a true nonfunctional status of the PCCs.
Adrenomedullary chromaffin cells can be divided into 2 distinct populations: those containing PNMT, predominantly storing epinephrine, and those lacking PNMT expression, mainly storing norepinephrine. 32 The 2 PCC samples that displayed the strongest intensity bands for PNMT on Western blot also demonstrated the highest relative concentrations of epinephrine in tumor tissue. This suggests a correlation between protein expression and functional enzymatic activity. In 6 out of 8 PCCs, Western blot analysis for PNMT revealed an additional band at 25 kDa, absent in normal canine adrenal tissue or canine adrenal medullary tissue. This might indicate tumor‐specific splice isoforms or posttranslational modifications of PNMT. Tissue‐specific isoforms of PNMT with molecular weights of 38 kDa for adrenal PNMT and 25 kDa for brain PNMT have been described in rats. 33 Interestingly, in rats, the 25 kDa isoform appears to have low affinity for norepinephrine. 33 This finding might explain the presence of the 25 kDa band in PCC tissue in dogs, which does not seem to correlate with epinephrine tumor contents. Further investigation is warranted to elucidate the role and significance of this 25 kDa band in the context of PNMT expression and enzymatic activity in canine PCCs.
In a previous study focusing on TCA cycle metabolite profiling in humans with PCCs and paragangliomas, a cutoff of 97.7 for the succinate : fumarate ratio was established, offering 93% sensitivity and 97% specificity for diagnosing SDHx‐mutated tumors. 7 A more recent study that used the same extraction method as in the present study, determined a cutoff of 40 for the succinate : fumarate ratio, successfully classifying all human SDHx‐wildtype tumors without any false‐positives. 8 In the present study, the PCC suspected of an SDHx mutation exhibited a succinate : fumarate ratio of 110, while the median succinate : fumarate ratio in other PCCs was 4.4. Extrapolating this cutoff value of 40 to dogs seems reasonable, given the application of the same methodology. Nevertheless, additional validation studies in dogs are necessary to ensure the reliability of this proposed cutoff.
As our focus was solely on extreme outliers, there is a possibility that less extreme outliers with potential underlying mutations in SDHx, FH, or IDH might have been overlooked. Concerning the succinate : fumarate ratio, no other outliers were detected. For the 2 cases with a high fumarate : malate ratio, an underlying FH mutation seems unlikely, as this ratio did not exceed the proposed cutoff of 7.0 used in humans to identify FH mutations in PCCs. 6 Furthermore, these outliers had ratios not even 2‐fold higher than those in the other PCCs, while 60‐ to 80‐fold increases have been described in human FH‐mutated PCCs. 6 An elevation of 2‐hydroxyglutarate by at least 100‐fold is used in humans to identify IDH‐mutated tumors. 6 In our study, the outlier with a high 2‐hydroxyglutarate concentration exhibited a 118‐fold elevation, aligning with the criteria for an underlying IDH mutation. Future studies are warranted to explore the applicability of these cutoffs to canine PCCs and to validate their diagnostic relevance in this context.
In humans, SDHx‐mutated tumors exhibit higher succinate and lower fumarate, citrate, cis‐aconitate, and isocitrate compared to tumors without SDHx mutations. 7 This aligns with the metabolite levels observed in the suspected SDHx‐mutated PCC sample from our study, although the decrease in cis‐aconitate was less pronounced, and malate was also lower. In humans, TCA cycle linked amino acids, such as glutamate and aspartate are generally lower in SDHx‐mutated tumors, whereas glutamine is more abundant compared to PCCs because of other causes. 6 , 8 The findings in the suspected SDHx‐mutated PCC sample are not in agreement with this. A larger number of samples, with known SDHx mutation status, would enable more robust statistical analysis.
This study reports metabolic changes related to the TCA cycle in canine PCCs compared to NAs. The succinate : fumarate ratio was significantly higher in PCCs than NAs, and this difference remained significant even after the suspected SDHx‐mutated sample was excluded from analysis. This might reflect an overall decreased SDH activity in PCCs compared to NAs. In turn, this could explain the lower fumarate levels and lower fumarate : malate ratio in PCCs. In people, it has been suggested that SDH inactivation might be more complete in SDHB‐mutated tumors than in tumors harboring mutations in other subunits. 34 In dogs, the functional effects of SDHx mutations have not been studied. The lower concentrations of glutamate and glutamine in PCCs compared to NAs might suggest that glutamine metabolism is involved in the pathogenesis of PCCs. 35 Future research should delve into the mechanisms underlying the observed metabolic changes in PCCs, focusing on elucidating the role of SDH activity and glutamine metabolism.
The main limitation of our study is the lack of genetic testing in our dogs. Ideally, to confirm the presence of an SDHx mutation, whole‐genome sequencing should be performed. Alternatively, Sanger sequencing of SDHB and SDHD, previously reported in dogs, could be conducted. 12 , 13 However, mutations in other SDH‐genes, such as SDHA, SDHC, and SDHAF2, have been described in humans. 3 If initial screening of SDHB and SDHD could not explain the high tumor succinate : fumarate ratio, exhaustive testing of all SDHx genes would be required to reveal any additional genetic variants. Therefore, whole‐genome sequencing appears to be a more reasonable and comprehensive approach. This method would also enable a thorough genetic screening of the other PCC samples.
A major advantage of metabolite profiling is its utility in interpreting gene variants, particularly those of uncertain significance. 8 , 9 Despite the support computational predictive programs provide in the interpretation of sequence variants, functional studies can offer a more definitive assessment of impact. 36 Metabolomics, by measuring precursors and products, can provide valuable information about gene variants of metabolic enzymes like SDHx and FH, thereby aiding in their classification. 8 , 9 Moreover, targeted metabolomics offers the benefit of being faster and more cost‐effective compared to sequencing analyses. 8 Our study's methodology allows for a multi‐omics approach, enabling targeted metabolite profiling, RNA, and protein analyses with minimal sample requirements, as outlined in a previous publication. 17
Targeted metabolomics can also be applied to improve therapy for humans with PCCs. For instance, TCA cycle aberrations resulting from SDHx or FH mutations lead to the accumulation of oncometabolites and, secondarily, hypoxia‐inducible factors. This triggers downstream activation of pseudohypoxia pathways. These altered pathways in tumor metabolism can be pharmacologically targeted, potentially identifying new treatment targets. 8 Given the current lack of effective medical treatment options for PCCs in dogs, 14 targeted metabolomics could prove valuable in uncovering new therapeutic approaches in this species as well.
In conclusion, this study has shed light on the metabolomic profile of adrenal tissues from healthy dogs and dogs with PCCs, advancing our understanding of the pathophysiological processes involved in canine PCCs and opening avenues for improved diagnosis and potentially guiding future therapeutic interventions. Our study provides insights into catecholamine content in PCCs compared to NAs. The identification of a high tumor succinate : fumarate ratio hints at a potential SDHx mutation, emphasizing the relevance of targeted metabolomics in unraveling underlying pathogenic variants. Our findings provide a novel framework for future studies exploring metabolomic signatures of PCCs and other adrenal diseases in dogs.
CONFLICT OF INTEREST DECLARATION
Authors declare no conflict of interest.
OFF‐LABEL ANTIMICROBIAL DECLARATION
Authors declare no off‐label use of antimicrobials.
INSTITUTIONAL ANIMAL CARE AND USE COMMITTEE (IACUC) OR OTHER APPROVAL DECLARATION
Authors declare no IACUC or other approval was needed, as judged by the Utrecht University's DEC (Animal Ethics Committee). Signed informed consent was obtained from all owners prior to study participation.
HUMAN ETHICS APPROVAL DECLARATION
Authors declare human ethics approval was not needed for this study.
Supporting information
Table S1. Designed primer pairs for adrenomedullary markers CHGA, PNMT, and TH, as well as adrenocortical markers STAR, CYP17A1, and CYP11B.
ACKNOWLEDGMENTS
This study was supported by donations from Maria Naundorf van Gorkum Foundation, Foundation Abri, and Friends of VetMed.
van den Berg MF, Bechmann N, Kooistra HS, et al. Metabolomic profiling of pheochromocytomas in dogs: Catecholamine phenotype and tricarboxylic acid cycle metabolites. J Vet Intern Med. 2024;38(5):2415‐2424. doi: 10.1111/jvim.17148
REFERENCES
- 1. van den Berg MF, Galac S. Canine phaeochromocytoma: a guide to diagnosis and treatment. Companion Anim. 2024;29(1):2‐10. [Google Scholar]
- 2. Eisenhofer G, Pamporaki C, Lenders JWM. Biochemical assessment of pheochromocytoma and paraganglioma. Endocr Rev. 2023;44(5):862‐909. [DOI] [PubMed] [Google Scholar]
- 3. Fishbein L, Leshchiner I, Walter V, et al. Comprehensive molecular characterization of pheochromocytoma and paraganglioma. Cancer Cell. 2017;31(2):181‐193. [DOI] [PMC free article] [PubMed] [Google Scholar]
- 4. Favier J, Amar L, Gimenez‐Roqueplo AP. Paraganglioma and phaeochromocytoma: from genetics to personalized medicine. Nat Rev Endocrinol. 2015;11(2):101‐111. [DOI] [PubMed] [Google Scholar]
- 5. Eijkelenkamp K, Osinga TE, Links TP, van der Horst‐Schrivers ANA. Clinical implications of the oncometabolite succinate in SDHx‐mutation carriers. Clin Genet. 2020;97(1):39‐53. [DOI] [PMC free article] [PubMed] [Google Scholar]
- 6. Richter S, Gieldon L, Pang Y, et al. Metabolome‐guided genomics to identify pathogenic variants in isocitrate dehydrogenase, fumarate hydratase, and succinate dehydrogenase genes in pheochromocytoma and paraganglioma. Genet Med. 2019;21(3):705‐717. [DOI] [PMC free article] [PubMed] [Google Scholar]
- 7. Richter S, Peitzsch M, Rapizzi E, et al. Krebs cycle metabolite profiling for identification and stratification of pheochromocytomas/paragangliomas due to succinate dehydrogenase deficiency. J Clin Endocrinol Metab. 2014;99(10):3903‐3911. [DOI] [PMC free article] [PubMed] [Google Scholar]
- 8. Richter S, Garrett TJ, Bechmann N, et al. Metabolomics in paraganglioma: applications and perspectives from genetics to therapy. Endocr Relat Cancer. 2023;30(6):e220376. [DOI] [PMC free article] [PubMed] [Google Scholar]
- 9. Wallace PW, Conrad C, Brückmann S, et al. Metabolomics, machine learning and immunohistochemistry to predict succinate dehydrogenase mutational status in phaeochromocytomas and paragangliomas. J Pathol. 2020;251(4):378‐387. [DOI] [PMC free article] [PubMed] [Google Scholar]
- 10. Eisenhofer G, Lenders JWM, Goldstein DS, et al. Pheochromocytoma catecholamine phenotypes and prediction of tumor size and location by use of plasma free metanephrines. Clin Chem. 2005;51(4):735‐744. [DOI] [PubMed] [Google Scholar]
- 11. Eisenhofer G, Pacak K, Huynh TT, et al. Catecholamine metabolomic and secretory phenotypes in phaeochromocytoma. Endocr Relat Cancer. 2011;18(1):97‐111. [DOI] [PMC free article] [PubMed] [Google Scholar]
- 12. Holt DE, Henthorn P, Howell VM, Robinson BG, Benn DE. Succinate dehydrogenase subunit D and succinate dehydrogenase subunit B mutation analysis in canine phaeochromocytoma and paraganglioma. J Comp Pathol. 2014;151(1):25‐34. [DOI] [PubMed] [Google Scholar]
- 13. Korpershoek E, Dieduksman DAER, Grinwis GCM, et al. Molecular alterations in dog pheochromocytomas and paragangliomas. Cancers (Basel). 2019;11(5):607. [DOI] [PMC free article] [PubMed] [Google Scholar]
- 14. van den Berg MF, Kooistra HS, Grinwis GCM, et al. Whole transcriptome analysis of canine pheochromocytoma and paraganglioma. Front Vet Sci. 2023;10:10. [DOI] [PMC free article] [PubMed] [Google Scholar]
- 15. Constantinescu G, Preda C, Constantinescu V, et al. Silent pheochromocytoma and paraganglioma: systematic review and proposed definitions for standardized terminology. Front Endocrinol (Lausanne). 2022;13:1021420. [DOI] [PMC free article] [PubMed] [Google Scholar]
- 16. van den Berg MF, Kooistra HS, Grinwis GCM, et al. Reference intervals for plasma, urinary, and salivary concentrations of free metanephrines in dogs: relevance to the diagnosis of pheochromocytoma. J Vet Intern Med. 2023;37(1):173‐183. [DOI] [PMC free article] [PubMed] [Google Scholar]
- 17. Bechmann N, Watts D, Steenblock C, et al. Adrenal hormone interactions and metabolism: a single sample multi‐omics approach. Horm Metab Res. 2021;53(5):326‐334. [DOI] [PMC free article] [PubMed] [Google Scholar]
- 18. Eisenhofer G, Goldstein DS, Stull R, et al. Simultaneous liquid‐chromatographic determination of 3,4‐dihydroxyphenylglycol, catecholamines, and 3,4‐dihydroxyphenylalanine in plasma, and their responses to inhibition of monoamine oxidase. Clin Chem. 1986;32(11):2030‐2033. [PubMed] [Google Scholar]
- 19. Marshall OJ. PerlPrimer: cross‐platform, graphical primer design for standard, bisulphite and real‐time PCR. Bioinformatics. 2004;20(15):2471‐2472. [DOI] [PubMed] [Google Scholar]
- 20. Zuker M. Mfold web server for nucleic acid folding and hybridization prediction. Nucleic Acids Res. 2003;31(13):3406‐3415. [DOI] [PMC free article] [PubMed] [Google Scholar]
- 21. Galac S, Kool MMJ, Naan EC, Daminet S, Mol JA, Kooistra HS. Expression of the ACTH receptor, steroidogenic acute regulatory protein, and steroidogenic enzymes in canine cortisol‐secreting adrenocortical tumors. Domest Anim Endocrinol. 2010;39(4):259‐267. [DOI] [PubMed] [Google Scholar]
- 22. Vandesompele J, De Preter K, Pattyn F, et al. Accurate normalization of real‐time quantitative RT‐PCR data by geometric averaging of multiple internal control genes. Genome Biol. 2002;3(7):RESEARCH0034. [DOI] [PMC free article] [PubMed] [Google Scholar]
- 23. Livak KJ, Schmittgen TD. Analysis of relative gene expression data using real‐time quantitative PCR and the 2−ΔΔCT method. Methods. 2001;25(4):402‐408. [DOI] [PubMed] [Google Scholar]
- 24. Schneider CA, Rasband WS, Eliceiri KW. NIH image to ImageJ: 25 years of image analysis. Nat Methods. 2012;9(7):671‐675. [DOI] [PMC free article] [PubMed] [Google Scholar]
- 25. Reusch CE. Pheochromocytoma and multiple endocrine neoplasia. In: Feldman E, Nelson R, Reusch C, Scott‐Moncrieff J, Behrend E, eds. Canine and Feline Endocrinology. 4th ed. St. Louis, MO: Elsevier; 2015:521‐554. [Google Scholar]
- 26. Isobe K, Nakai T, Yukimasa N, Nanmoku T, Takekoshi K, Nomura F. Expression of mRNA coding for four catecholamine‐synthesizing enzymes in human adrenal pheochromocytomas. Eur J Endocrinol. 1998;138(4):383‐387. [DOI] [PubMed] [Google Scholar]
- 27. Cleary S, Brouwers FM, Eisenhofer G, et al. Expression of the noradrenaline transporter and phenylethanolamine N‐methyltransferase in normal human adrenal gland and phaeochromocytoma. Cell Tissue Res. 2005;322(3):443‐453. [DOI] [PubMed] [Google Scholar]
- 28. Fernandez‐Ruiz JJ, Bukhari AR, Hernandez ML, et al. Sex‐ and age‐related changes in catecholamine metabolism and release of rat adrenal gland. Neurobiol Aging. 1989;10(4):331‐335. [DOI] [PubMed] [Google Scholar]
- 29. Amano A, Tsunoda M, Aigaki T, Maruyama N, Ishigami A. Age‐related changes of dopamine, noradrenaline and adrenaline in adrenal glands of mice. Geriatr Gerontol Int. 2013;13(2):490‐496. [DOI] [PubMed] [Google Scholar]
- 30. Ozaki T. Noradrenaline in the adrenals of young dogs. Tohoku J Exp Med. 1956;63(2–3):241‐243. [DOI] [PubMed] [Google Scholar]
- 31. Bechmann N, Eisenhofer G. Hypoxia‐inducible factor 2α: a key player in tumorigenesis and metastasis of pheochromocytoma and paraganglioma? Exp Clin Endocrinol Diabetes. 2022;130(5):282‐289. [DOI] [PubMed] [Google Scholar]
- 32. Eisenhofer G, Huynh TT, Hiroi M, Pacak K. Understanding catecholamine metabolism as a guide to the biochemical diagnosis of pheochromocytoma. Rev Endocr Metab Disord. 2001;2(3):297‐311. [DOI] [PubMed] [Google Scholar]
- 33. Yu PH. Phenylethanolamine N‐methyltransferase from the brain and adrenal medulla of the rat: a comparison of their properties. Neurochem Res. 1978;3(6):755‐762. [DOI] [PubMed] [Google Scholar]
- 34. Letouzé E, Martinelli C, Loriot C, et al. SDH mutations establish a hypermethylator phenotype in paraganglioma. Cancer Cell. 2013;23(6):739‐752. [DOI] [PubMed] [Google Scholar]
- 35. Jochmanova I, Pacak K. Pheochromocytoma: the first metabolic endocrine cancer. Clin Cancer Res. 2016;22(20):5001‐5011. [DOI] [PMC free article] [PubMed] [Google Scholar]
- 36. Richards S, Aziz N, Bale S, et al. Standards and guidelines for the interpretation of sequence variants: a joint consensus recommendation of the American College of Medical Genetics and Genomics and the Association for Molecular Pathology. Genet Med. 2015;17(5):405‐424. [DOI] [PMC free article] [PubMed] [Google Scholar]
Associated Data
This section collects any data citations, data availability statements, or supplementary materials included in this article.
Supplementary Materials
Table S1. Designed primer pairs for adrenomedullary markers CHGA, PNMT, and TH, as well as adrenocortical markers STAR, CYP17A1, and CYP11B.