Figure 4.
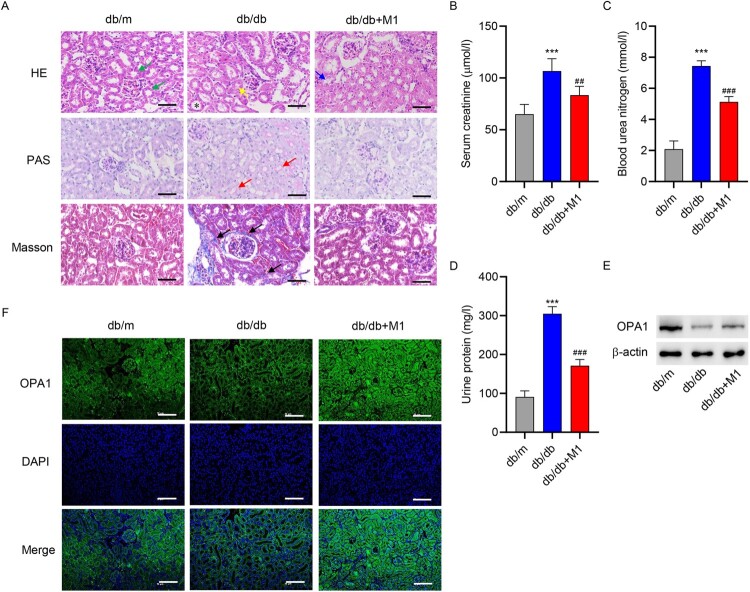
Promotion of mitochondrial fusion reversed kidney injury in mice. Eight-week-old diabetic mice were divided into a control group (db/m), model group (db/db), and model + mitochondrion fusion inducer M1 (db/db + M1) group that received intervention for 4 weeks. (A) HE, PAS, and Masson staining were used to analyze the pathological changes in renal tissues (scale bar, 50 μm). HE staining identified normal proximal tubules with narrow and irregular lumena, unclear cell boundaries, and the presence of brush border structures (green arrow) and abnormal proximal tubules with tubular dilatation (*), atrophy (yellow arrow), and loss of brush border integrity (blue arrow). PAS staining was used to identified renal tubular dilatation (red arrow). Masson staining identified extracellular matrix deposition (black arrow). Biochemical detection of (B) creatinine, (C) urea nitrogen and (D) urinary protein. (E) Western blotting and (F) immunofluorescence staining were used to determine OPA1 expression in renal tissues (scale bar, 100 μm). ***P < 0.001 versus db/m; ##P < 0.01, ###P < 0.001 versus db/db.

