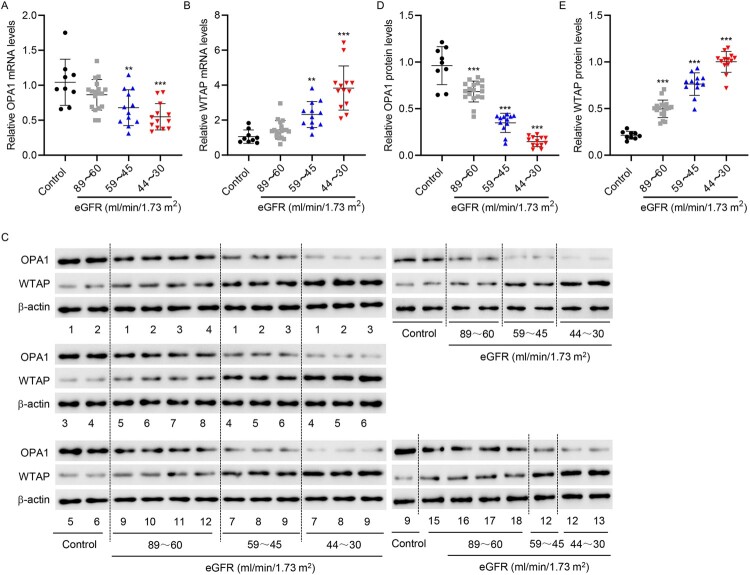
Figure 8.
OPA1 and WTAP expression in patients with DN. The renal tubules of DN patients were collected and divided into three groups according to eGFR (ml/min/1.73 m2) (The 89–60 group: 18 cases; 59–45 group: 12 cases; and 44–30 group: 13 cases). Simultaneously, the renal tubules of nine normal controls undergoing renal puncture were collected. (A, B) RT-qPCR and (C – E) Western blotting were used to determine OPA1 and WTAP expression. **P < 0.01, ***P < 0.001 versus control.

