. 2024 Aug 30;10:e52631. doi: 10.2196/52631
Copyright © Freda Halim, Allen Widysanto, Petra Octavian Perdana Wahjoepramono, Valeska Siulinda Candrawinata, Andi Setiawan Budihardja, Andry Irawan, Taufik Sudirman, Natalia Christina, Heru Sutanto Koerniawan, Jephtah Furano Lumban Tobing, Veli Sungono, Mona Marlina, Eka Julianta Wahjoepramono. Originally published in JMIR Medical Education (https://mededu.jmir.org)
This is an open-access article distributed under the terms of the Creative Commons Attribution License (https://creativecommons.org/licenses/by/4.0/), which permits unrestricted use, distribution, and reproduction in any medium, provided the original work, first published in JMIR Medical Education, is properly cited. The complete bibliographic information, a link to the original publication on https://mededu.jmir.org/, as well as this copyright and license information must be included.
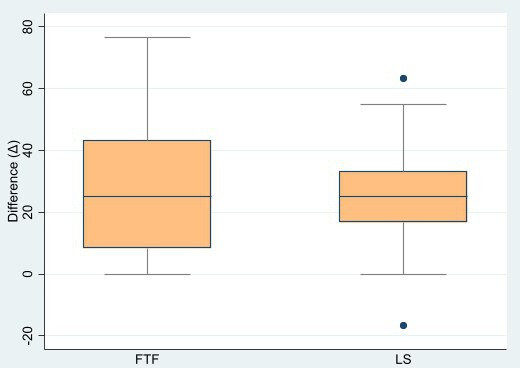
Figure 3. Box-plot graph of numerical differences of both groups’ scores. FTF: face-to-face; LS: live streaming.

