Fig 5.
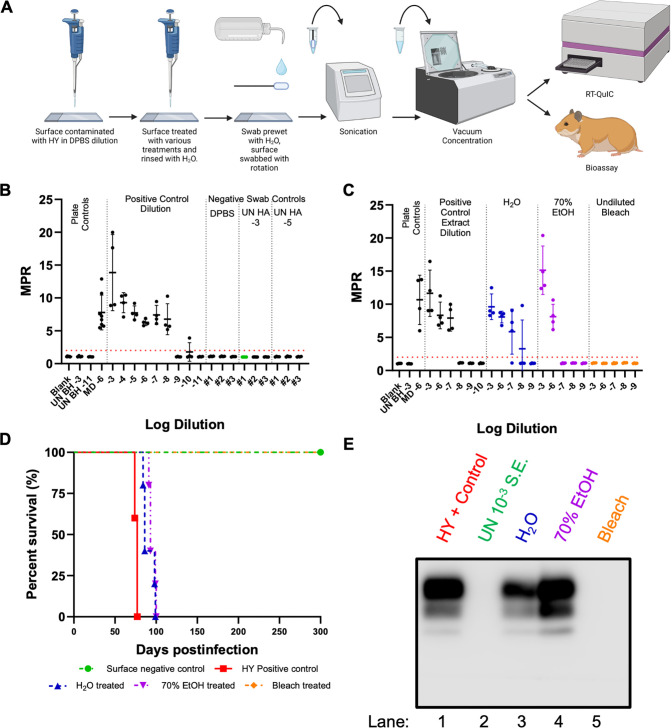
RT-QuIC and animal bioassay of swab extracts produced similar results. (A)Overview of surface prion contamination and swabbing procedure resulting in swab extracts that were analyzed by either (B and C)RT-QuIC (created with BioRender.com) (D)or animal bioassay. A positive fluorescence threshold (illustrated by the red line) was determined to be at 2. The maxpoint ratio reported is the ratio of the maximum fluorescence to the initial fluorescence reading obtained by the plate reader (mean ± standard deviation). (E)Western blot analysis of PK digested brain homogenates from bioassay results from panel D.

