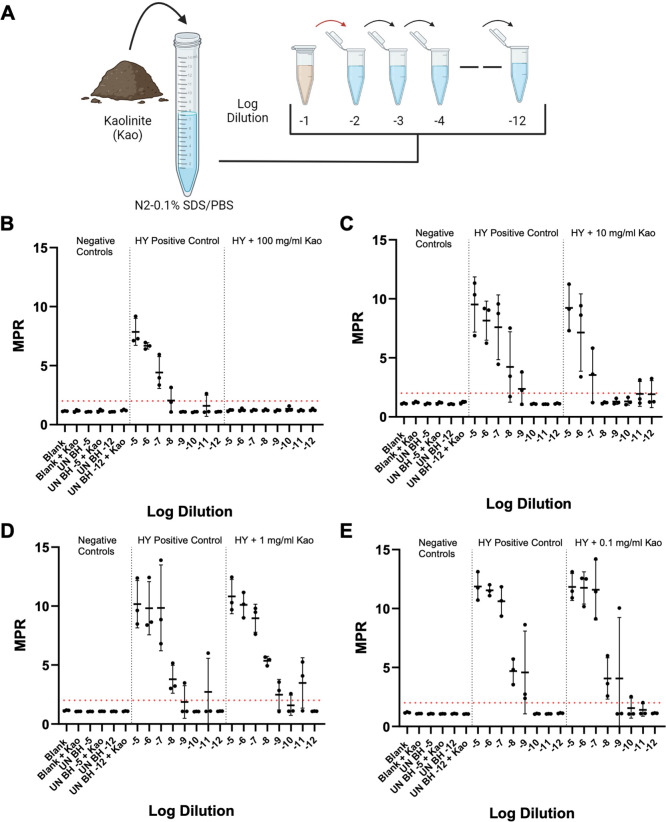
Fig 6.
Impact of soil on RT-QuIC detection of HY dilutions is dependent on soil concentration. (A)Overview of soil spiking procedure of tissue dilution solution for RT-QuIC analysis (created with BioRender.com). (B)RT-QuIC detection of HY dilutions prepared in tissue dilution solution with 100mg/mL of kaolinite. (C)RT-QuIC detection of HY dilutions prepared in tissue dilution solution with 10mg/mL of Kao. (D)RT-QuIC detection of HY dilutions prepared in tissue dilution solution with 1mg/mL of Kao. (E)RT-QuIC detection of HY dilutions prepared in tissue dilution solution with 0.1mg/mL of Kao. Negative plate controls include blank and uninfected brain homogenate of 10−5 and 10−12 with and without soil. A positive plate control consisted of a HY dilution series prepared in standard tissue dilution solution. A positive fluorescence threshold (illustrated by red line) was determined to be at 2. The maxpoint ratio reported is the ratio of the maximum fluorescence to the initial fluorescence reading obtained by the plate reader. Each point represents the average MPR from one biological replicate (mean ± standard deviation).

