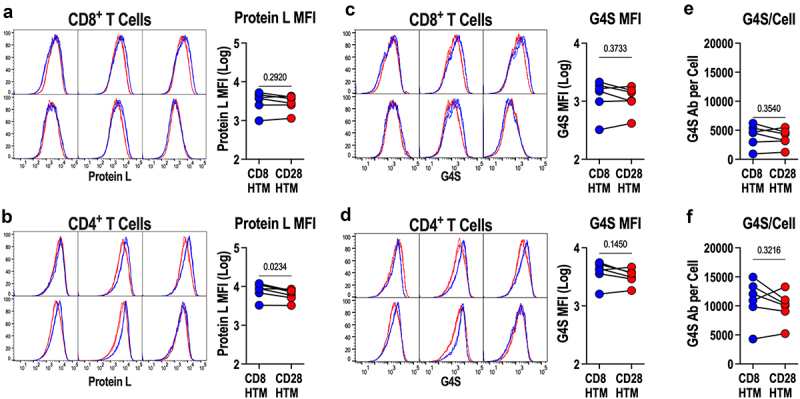
Figure 3.

CD8HTM and CD28HTM CAR expression. (a-b) surface CD8HTM and CD28HTM CAR expression was examined with protein L among CD8+ (a) and CD4+ (b) CAR-T cells produced from n = 6 donors. (c-d) surface CD8HTM and CD28HTM CAR expression was examined with anti-G4S antibody among CD8+ (c) and CD4+ (d) CAR-T cells produced from 6 donors. (e-f) bound anti-G4S antibodies/cell in c-d were quantified among CD8+ (e) and CD4+ (f) CAR-T cells. Flow cytometry plots in a-d indicate matched CD8HTM and CD28HTM CAR expression for each donor. All statistical comparisons are paired T-tests; symbols connected with a line represent a matched donor.
