
Figure 5.
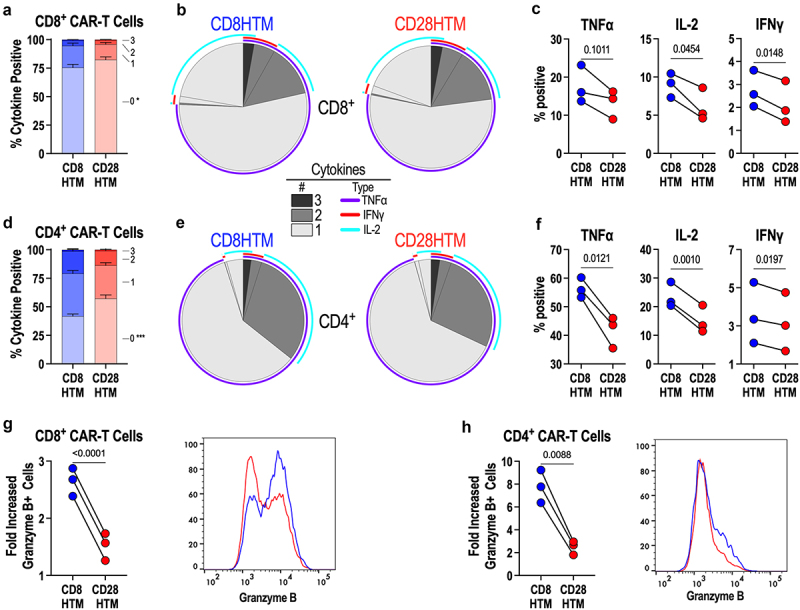
Enhanced cytokine production and cytolytic potential by CD8HTM CAR compared to CD28HTM CAR. (a-h) CD8HTM and CD28HTM CAR-T cells produced from n = 3 donors were stimulated with plate-bound recombinant GUCY2C extracellular domain protein, and intracellular cytokines (a-f), and granzyme B (g-h) were quantified by flow cytometry. (a,d) comparison of CD8+ T cells (a) and CD4+ T cells (d) producing 0-3 cytokines between CD8HTM and CD28HTM CARs. * p = .048; *** p = .0005 (b) SPICE plots demonstrating the average number and type of cytokine expression by CD8HTM and CD28HTM CAR-T cells among CD8+ (b) and CD4+ (e) CAR-T cells. Individual cytokine expression comparison between CD8HTM and CD28HTM CAR-T cells among CD8+ (c) and CD4+ (f) CAR-T cells. Granzyme B comparison between CD8HTM and CD28HTM CAR-T cells among CD8+ (g) and CD4+ (h) CAR-T cells. Representative flow cytometry plots are shown. Statistical analyses for a and d were performed using two-way ANOVA adjusted for multiple comparisons. Error bars reflect the SEM. Statistical comparisons for c, f, g, and h are paired T-tests; symbols connected with a line represent a matched donor.