
Figure 7.
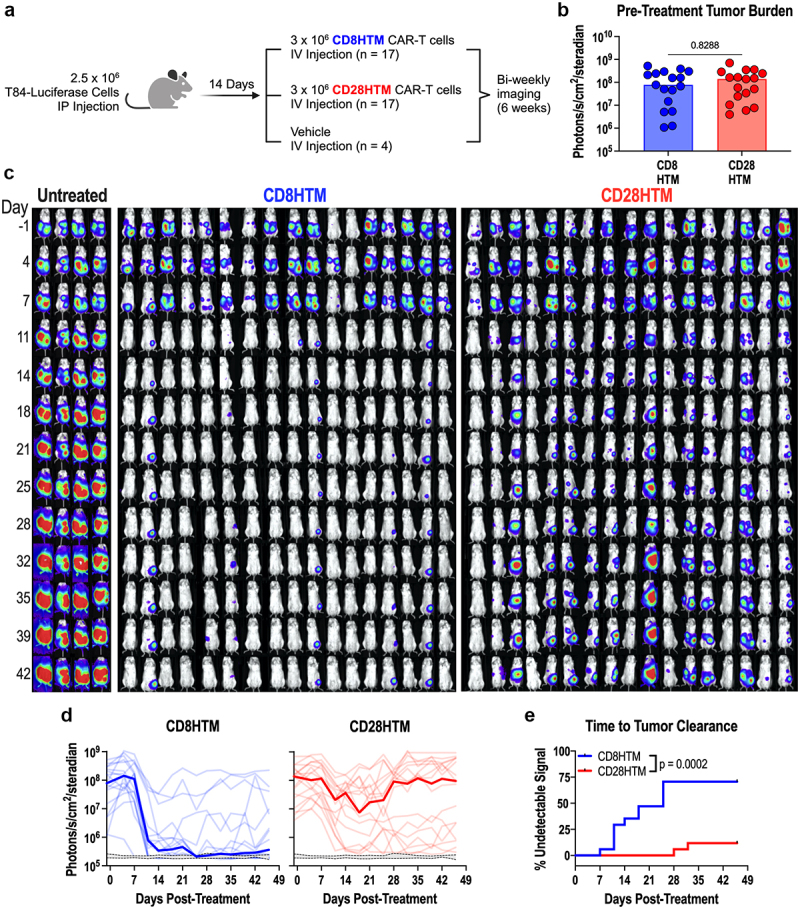
Enhanced antitumor efficacy of CD8HTM CAR compared to CD28HTM CAR. (a) experimental design (created with BioRender.com/w13b661). (b) Tumor burden comparison between CD8HTM and CD28HTM groups one day before treatment. (c) Longitudinal bioluminescence images. (d) Median (bold) and individual tumor burden comparison between CD8HTM and CD28HTM CAR-T cells. Grey range with dashed lines indicates the 95% confidence interval of baseline daily luminescence in tumor-free mice. (e) Time to tumor clearance comparison between CD8HTM and CD28HTM CAR-T cells determined by the day an animal’s signal reached that of tumor-free mice in d. An unpaired T-test was performed in b. Each dot represents a single animal. A Kaplan-Meier curve was used in e with the Log-rank (Mantel-Cox) test to determine the p-value.