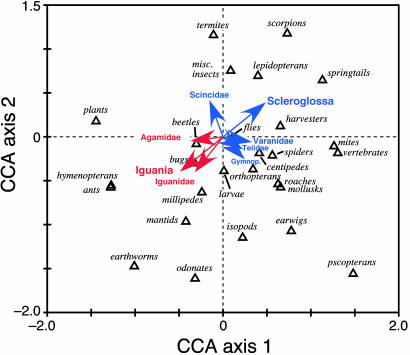
Fig. 2.
Biplot showing results of a canonical correspondence ordination analysis. This plot shows the position of each prey category on the first two axes of dietary niche space. Prey types that are eaten together are close to each other on this plot, whereas those that are seldom eaten by the same lizard species are far apart. The origin at 0.0, 0.0 represents the lowest common denominator or the overall lizard diet summed across all 184 species. Dietary generalists with broad food niches would lie in the interior of the plot near the origin, and specialists would be on peripheral areas of the diagram. Clades that significantly reduced variation are plotted with vectors radiating out from the origin. Lengths of vector arrows indicate significance strength, whereas tips represent the centroid of the prey types eaten by each clade. Scleroglossan clades are in blue, and iguanians clades are in red.

