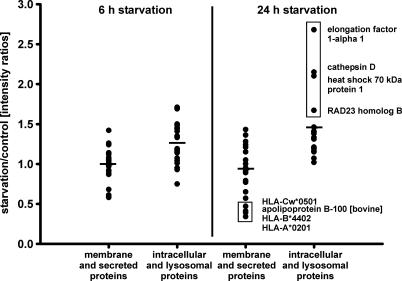
Fig. 2.
Altered peptide presentation on HLA-DR under starvation. Displayed are the relative intensity ratios of HLA-DR-eluted peptides from starved cells (6 and 24 h) and control cells as assessed by LC-MS. Peptides were quantified by their relative peak heights in mass spectra and grouped according to the cellular localization of their source proteins: membrane plus secreted proteins and intracellular plus lysosomal proteins. Data of serial LC-MS runs were normalized to the abundant peptide LSSWTAADTAAQITQR, which showed only marginal differences in presentation levels (Table 1). Horizontal bars indicate the mean intensity ratios for each group. Marked in a box are the four peptides that showed the highest presentation levels after 24 h of starvation. Their source proteins are localized in the nucleus and in lysosomes.

