. 2024 Sep 24;10(3):e004600. doi: 10.1136/rmdopen-2024-004600

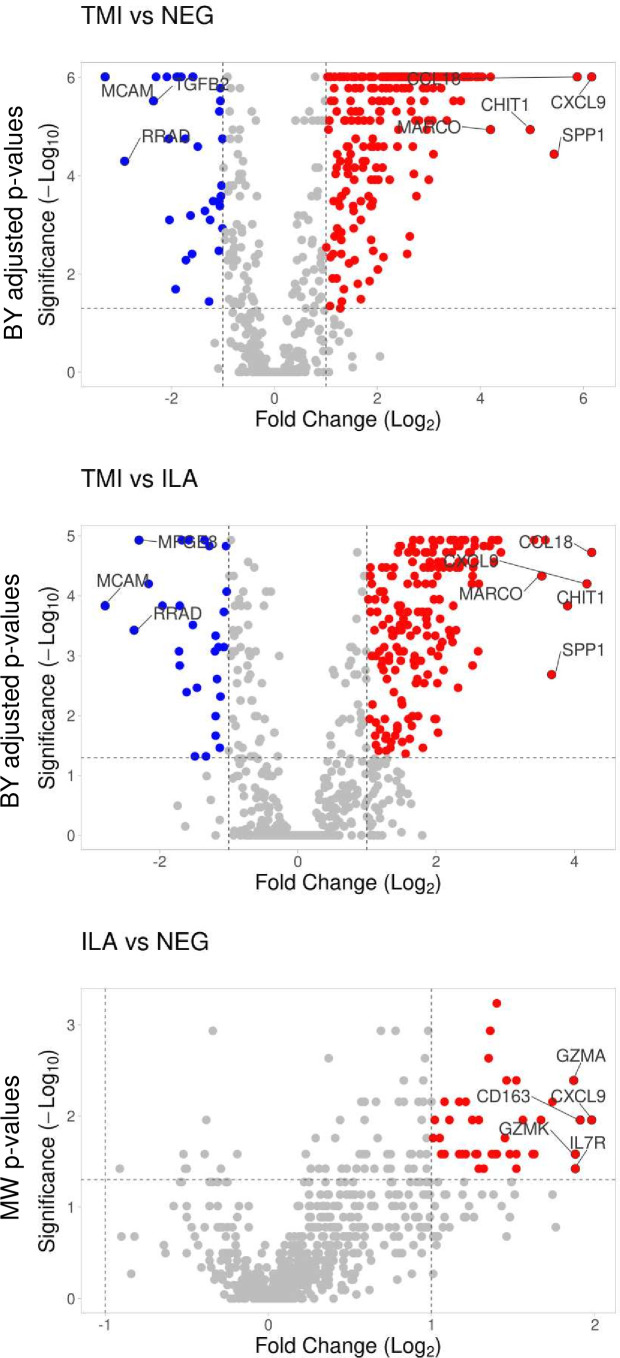
Figure 1. Visualisation of the differentially expressed genes between the histological patterns of inflammation in TABs. Volcano plots show Log2 (fold changes of normalised gene counts) in the x-axis; −log10 (p values) in the y-axis. Red dots represent the upregulated genes with >2 fold changes and p values <0.05. Blue dots represent the downregulated genes with <−2 fold changes and p values <0.05. Benjamini-Yekutieli (BY) adjusted p values are shown for TMI versus NEG and TMI versus ILA. Uncorrected p values resulting from Mann-Whitney (MW) test are shown for ILA versus NEG. ILA, inflammation limited to adventitia; NEG, TABs without inflammation; TABs, temporal artery biopsies; TMI, transmural inflammation.

Figure 1