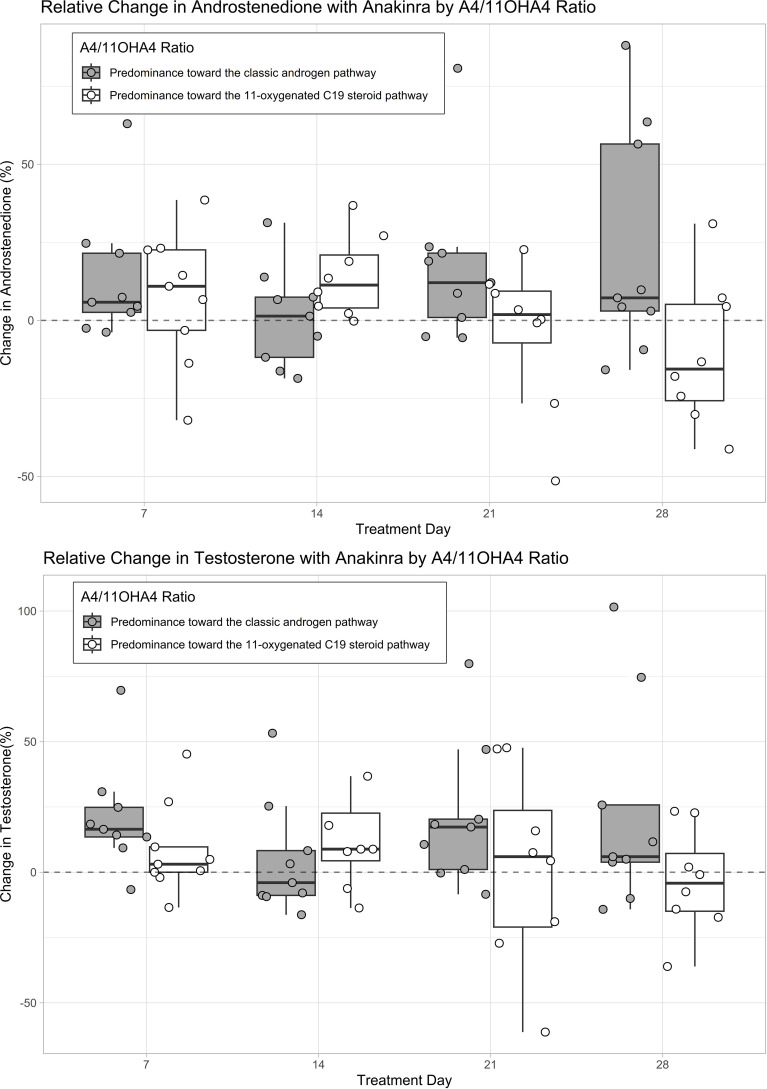
Figure 3.
Absolute changes in androgens with anakinra based on the predominant androgen pathway. The predominant androgen pathway was computed by dividing baseline androstenedione (A4) levels (classic androgen pathway) by baseline 11β-hydroxyandrostenedione (11OHA4) levels (11-oxygenated C19 steroid pathway) (42). A quotient above the median (0.872 nmol/nmol) was considered as a predominance toward the classic androgen pathway and a quotient below the median was considered as a predominance toward the 11-oxygenated C19 steroid pathway. The boxplots represent relative changes in androgens from baseline. Values above the dashed line represent an increase and values below the dashed line represent a decrease in androgens as compared to baseline. Androgen levels were measured with tandem-mass spectrometry (LC-MS/MS).

