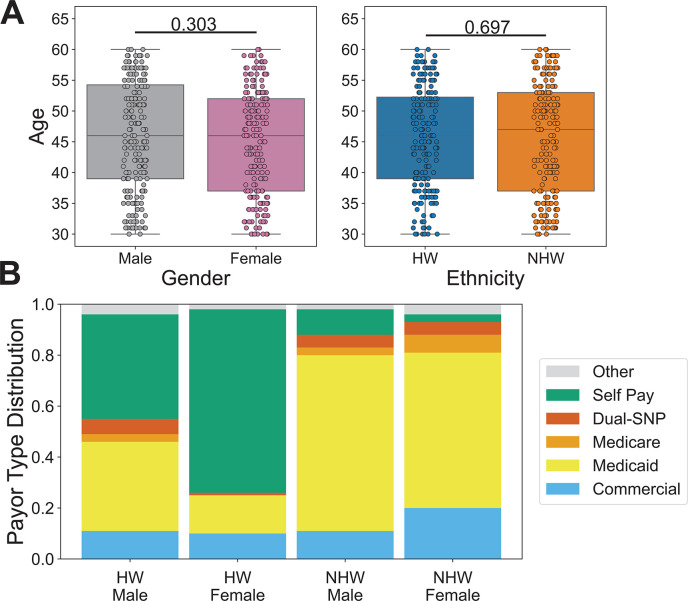
Fig 1.
Demographics of the study population. Remnant serum samples were collected from 400 individuals at Valleywise Health in Phoenix, AZ, and assayed using the HV1 PepSeq library. (A)The study population ranged in age from 30 to 60 years old and there was no statistically significant difference in the age distributions between genders and ethnicities (t-tests). Individual t-test P-values comparing male/female and HW/NHW ages are indicated above the respective plots. Each circle represents an individual. The line within each box represents the median, while the lower and upper bounds of each box represent the first and third quartiles, respectively. The whiskers extend to points that lie within 1.5 interquartile ranges of the first and third quartiles. (B)Payor sources varied substantially among focal subpopulations. Payor source was consolidated into six general categories (Table S4) and is shown for each subpopulation. Dual-SNP refers to any dual special needs plans for individuals who qualify for both Medicare and Medicaid.

