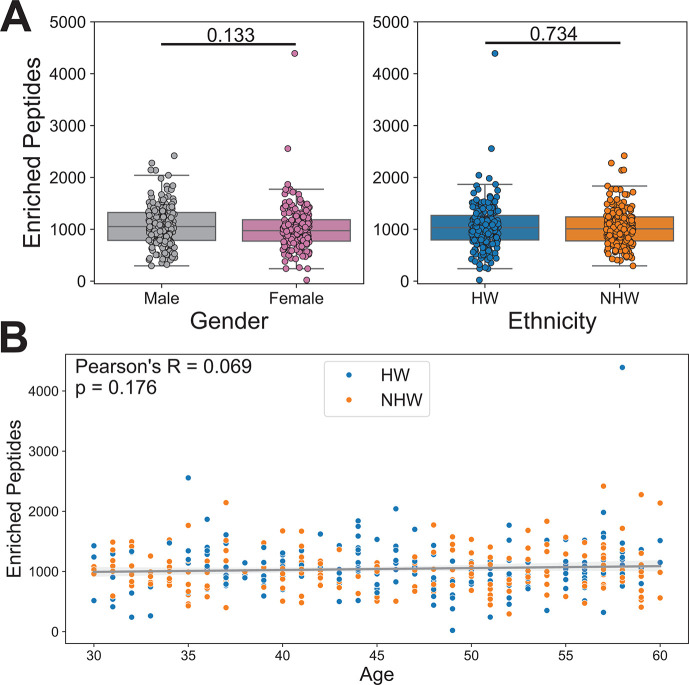
Fig 2.
PepSeq identifies similar overall levels of antibody reactivity against viral peptides between genders and ethnicities. (A) Box plots depicting the average number of enriched PepSeq peptides for each sample across four Z score thresholds (Z = 10, 15, 20, and 25). Average number of enriched peptides: female = 1,012.79, male = 1,074.14, HW = 1,050.13, NHW = 1,036.24. Individual t-test P-values comparing male/female and HW/NHW enriched peptide counts are indicated above the respective plots. Each circle represents an individual. The line within each box represents the median, while the lower and upper bounds of each box represent the first and third quartiles, respectively. The whiskers extend to points that lie within 1.5 interquartile ranges of the first and third quartiles. (B) Scatter plot with a best-fit line showing an average number of enriched peptides by age. Ethnicity is indicated by the color of the points, HW = blue and NHW = orange. The gray diagonal line indicates the best-fit linear regression with the shaded gray areas showing the 95% confidence interval. Pearson correlation was used to test for significance (P-value = 0.176).

