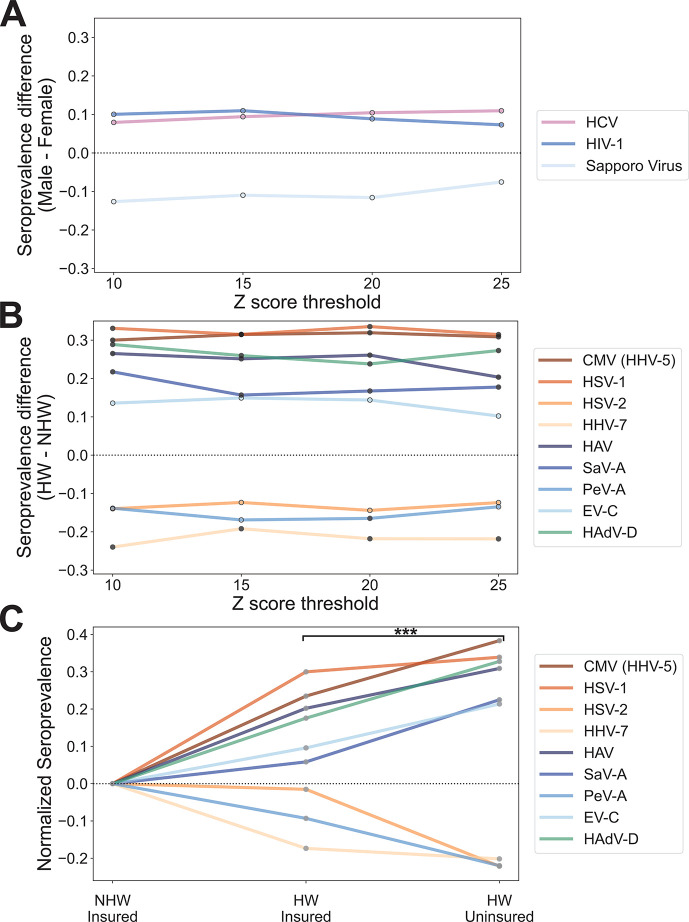
Fig 5.
Significant differences in seroprevalence by ethnicity and payor status. (A, B) Line plots depicting virus species with significant differences (P-value < 0.05) in seropositivity between (A) males and females or (B) HWs and NHWs calculated by fitting a generalized linear model at each Z score threshold before (outlined points) and after (filled points) Bonferroni correction for multiple tests. Negative differences indicate higher seroprevalence in females or NHWs and positive differences indicate higher seroprevalence in males or HWs for panels A and B, respectively. (C) Line plot depicting normalized seroprevalence for the same nine viruses shown in panel B, with values calculated separately for insured and uninsured individuals. Seroprevalence is being shown for a Z score threshold of 15 and was normalized against the value for insured NHWs. The asterisk indicates the significant increase in the absolute value of the normalized seroprevalence for uninsured HWs compared to insured HWs across all nine viruses (paired t-test P-value = 0.0002). Abbreviations: SaV-A, salivirus A; PeV-A, parechovirus A; EV-C, Enterovirus C; HAdV-D, human adenovirus D.

