Fig 7.
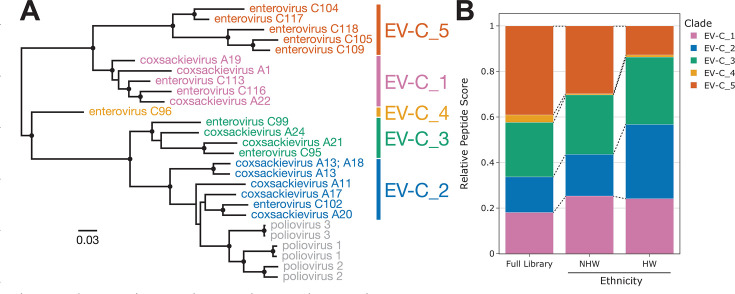
Antibody reactivity against clade-specific EV-C peptides. (A) Maximum-likelihood phylogenetic tree of all 27 ICTV listed EV-C isolates based on an amino acid alignment of the full polyprotein. Branch lengths indicate relative levels of amino acid divergence with the scale bar indicating the equivalent of 0.03 changes per site. Black circles indicate nodes with bootstrap support ≥80. Six phylogenetic clades are identified by the different colors. GenBank accession numbers for each sequence can be found in Table S8. (B) Bar plot showing clade-specific relative peptide scores for all “Other EV-C” peptides present in the HV1 PepSeq library (Full Library, null distribution) compared to the subset of enriched peptides for all HW and NHW individuals predicted to be seropositive against “Other EV-C” (Fig. 6B). Each color represents one of the “Other EV-C” phylogenetic clades shown in panel A.

