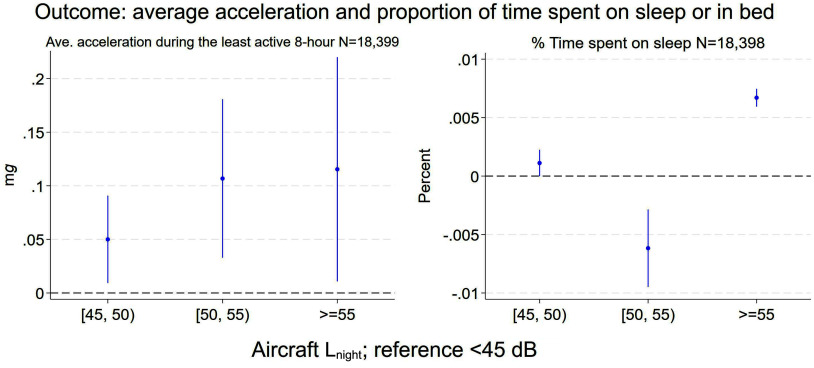
Figure 3.
Cross-sectional association between nighttime aircraft noise and actimetry data on average acceleration, measured in milligravitational units (mg) during the least active 8 h, and percentage of time spent on sleep or in bed using UK Biobank cohort (–18,399). Note: The figures display the point estimate (), and 95% CIs. represents the increment in the absolute value of the outcome when exposed to higher aircraft noise categories, in comparison with those exposed to dB. refers to the A-weighted equivalent noise level () measured in decibels (dB) over the 8-h night period from 23:00 hours to 07:00 hours. All models have been adjusted for sex; ethnicity; age in 2006; BMI; ever seen a psychiatrist or doctor (GP) for nerves, anxiety, tension, or depression; smoking status; alcohol consumption; total number of vigorous or moderate physical activities (in days) a participant typically reported doing in a week; average yearly household income before tax; Townsend deprivation index at recruitment by place of residence; nighttime road traffic noise; nighttime rail traffic noise; concentration; concentration; and greenspace percentage within a buffer of . The numeric results can be found in Excel Tables S1 and S2. BMI, body mass index; CI, confidence interval; GP, general practitioner.

