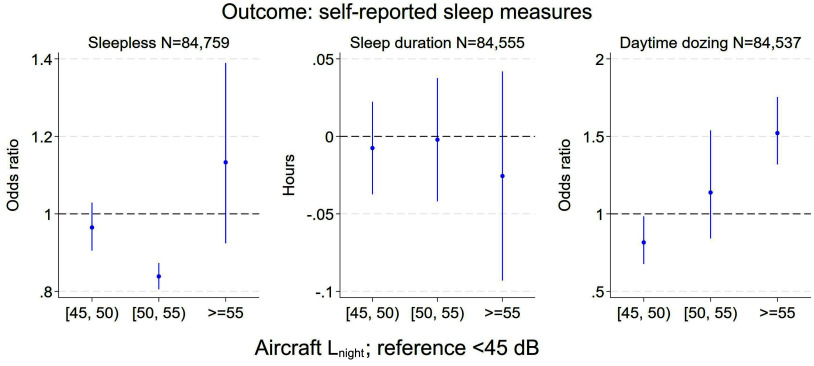
Figure 5.
Repeated cross-sectional association between nighttime aircraft noise and self-reported sleep outcomes using UK Biobank cohort (–84,759). Note: The figures “Sleepless” (left) and “Daytime Dozing” (right) illustrate the ORs and 95% CIs, whereas the “Sleep Duration” (middle) figure presents the point estimate () and 95% CIs. The OR represents the likelihood of someone reporting more severe sleep disturbance outcomes when exposed to noise levels dB in comparison with those exposed to dB; represents the increment in the absolute value of the outcome when exposed to higher aircraft noise categories, in comparison with those exposed to dB. refers to the A-weighted equivalent noise level () measured in decibels (dB) over the 8-h night period from 23:00 hours to 07:00 hours. All models have been adjusted for sex; ethnicity; age in 2006 and 2011; BMI; ever seen a psychiatrist or doctor (GP) for nerves, anxiety, tension, or depression; smoking status; alcohol consumption; total number of vigorous or moderate physical activities (in days) a participant typically reported doing in a week; average yearly household income before tax; Townsend deprivation index at the time of recruitment from the national census output areas associated with the participant’s place of residence; nighttime road traffic noise; nighttime rail traffic noise; concentration; concentration; and greenspace percentage within a buffer of . The numeric results can be found in Excel Tables S6, S7, and S8. BMI, body mass index; CI, confidence interval; GP, general practitioner; OR, odds ratio.

