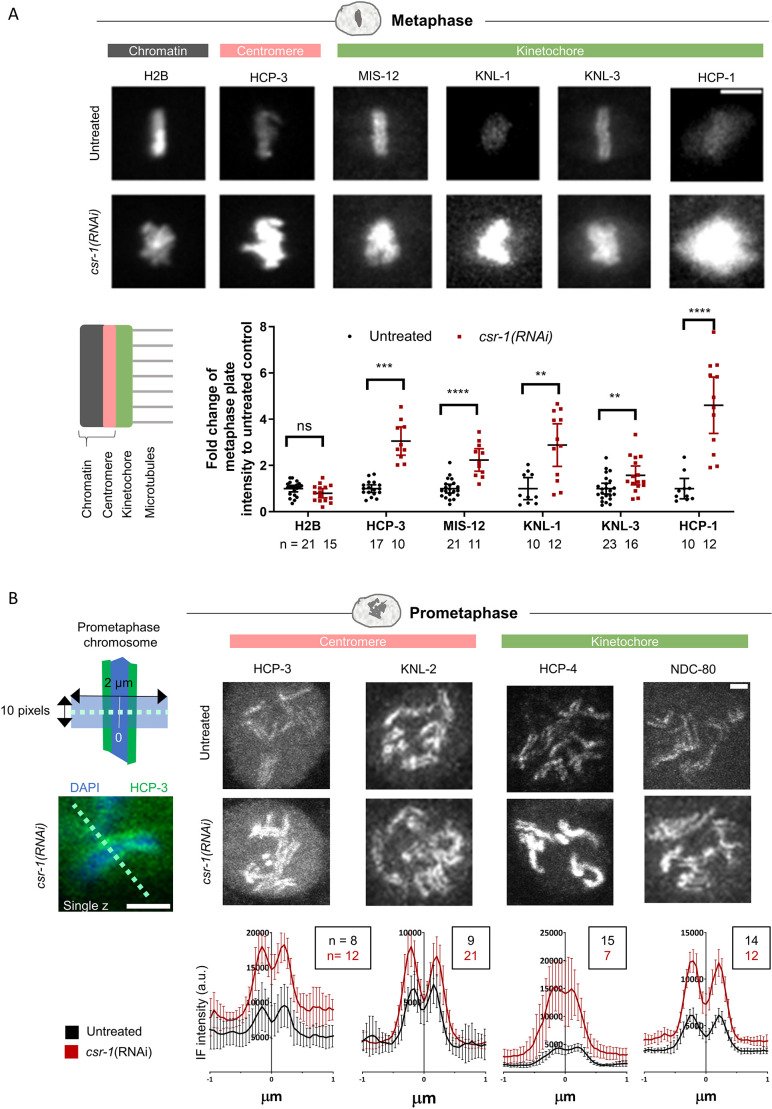
Fig. 2.
CSR-1 depletion affects kinetochore and centromere protein localization. (A) Maximum-projected live-cell images of metaphase chromosomes stained for the indicated proteins in untreated and csr-1(RNAi) one-cell embryos (top). Scale bar: 5 μm. Bottom-left: diagram shows a schematic of the constitutive centromere proteins (pink) on chromatin, and the kinetochore components (green), which make attachments to microtubules. Bottom-right: fluorescence intensities on chromatin of different fluorescently tagged kinetochore proteins, as well as histone H2B and HCP-3, were quantified as described in Fig. S2B and in the Materials and Methods. Data are presented as mean±95% confidence interval. The n values shown represent the number of embryos analyzed. **P<0.01; ***P<0.001; ****P<0.0001; ns, not significant (two-tailed unpaired t-test). (B) Immunofluorescence images and quantification of prometaphase chromosomes from a single plane in untreated and csr-1(RNAi) embryos. Fixed embryos at the same cell stage were used to compare the protein distribution and level on condensed chromosomes between untreated control and csr-1(RNAi) embryos (HCP-3, two-cell stage; KNL-2, two-cell stage; HCP-4, one-cell stage; NDC-80, two-cell stage). The mid-point between the two peaks was taken as the center (0 μm) to align the line scan intensity profiles of different chromosomes. Representative images of embryos stained for the indicated proteins and the corresponding quantifications of immunofluorescence (IF) intensity are shown on the right. Data are presented as mean±95% confidence interval (a.u., arbitrary units). The n values shown represent the number of chromosomes analyzed. Line scan profiles were generated and quantified as described in the Materials and Methods section. The diagram on the top left shows the alignment of line scan measurements. The image on the bottom left shows an example of a chosen chromosome and a 2 µm dashed line drawn along the chromosome width. Scale bars: 1 μm.

