Fig. 3.
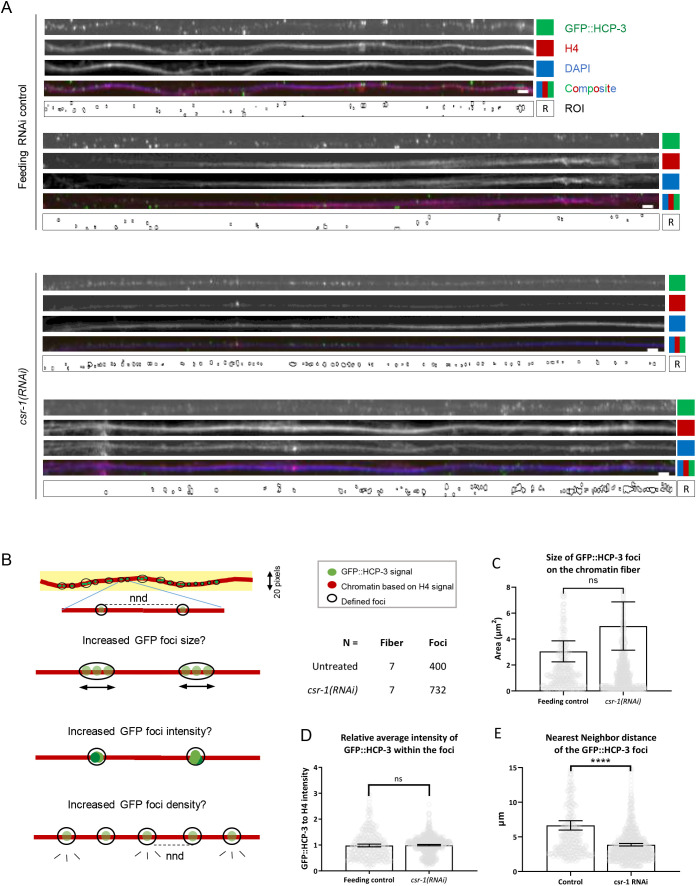
Distribution of GFP::HCP-3 foci on stretched chromatin fibers. (A) Representative images of GFP::HCP-3-containing chromatin fibers showing the change of chromatin HCP-3 distribution upon CSR-1 depletion. Stretched chromatin fibers were prepared from the feeding RNAi control and csr-1(RNAi) embyro lysates. The chromatin fibers were immunostained to detect GFP (GFP::HCP-3) and histone H4, and DNA was labeled with DAPI. Regions of GFP::HCP-3 foci were defined (ROI) using the GFP::HCP-3 channel. Scale bars: 10 μm. Additional chromatin fiber images are shown in Fig. S3. (B) Diagram explaining how the GFP::HCP-3 foci on the chromatin fibers were characterized in this study. Chromatin fibers were selected using 20-pixel-wide line (yellow background) drawn across the length of fiber (red). A GFP intensity threshold was applied (see Fig. S2C and Materials and Methods) to define the GFP::HCP-3 foci (ROI) based on size and circularity filters. Brighter GFP::HCP-3 on stretched chromatin in this analysis can be resolved into regions of GFP foci that appear either brighter (increased intensity), bigger (increased area) or denser (reduced distance to nearby foci; measured as nearest neighbor distance, nnd). The n values for quantification are shown. (C–E) Properties of the GFP::HCP-3 foci were quantified, including the (C) foci size, (D) foci average intensity and (E) nearest neighbor distance (NND), which is inversely correlated to the foci density. The GFP::HCP-3 foci intensities were normalized with the corresponding histone H4 intensities. Data are presented as mean±95% confidence interval. Feeding RNAi control, n=400 foci from seven fibers; csr-1(RNAi), n=723 foci from seven fibers. ****P<0.0001; ns, not significant (two-tailed unpaired t-test).

