Fig. 4.
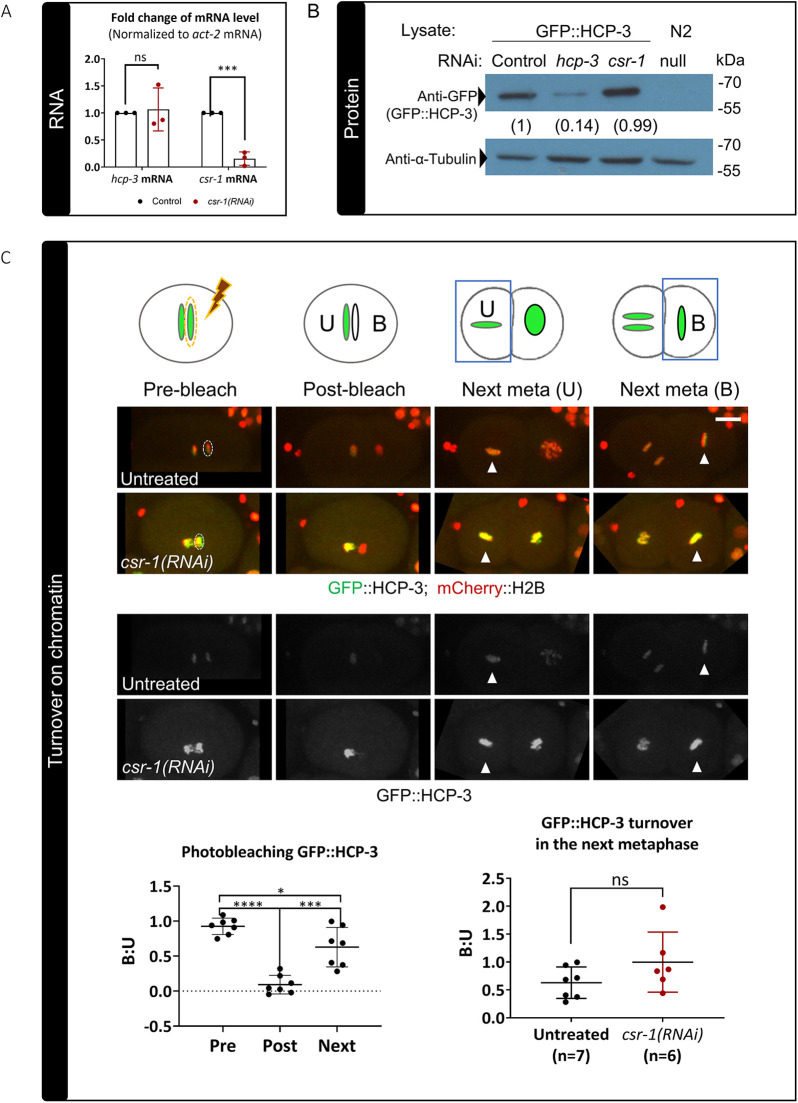
Effect of CSR-1 depletion on HCP-3 expression and stability on chromatin. (A) Relative fold change of hcp-3 and csr-1 mRNA levels in the csr-1(RNAi) embryos as compared to the feeding RNAi control. The mRNA levels are normalized to those of act-2 mRNA. Three biological replicates were performed, and the data are presented as mean±s.d. ***P<0.001; ns, not significant (two-tailed unpaired t-test). (B) Immunoblotting shows that the GFP::HCP-3 protein level remains unchanged in csr-1(RNAi) embryos as compared to levels in the feeding RNAi control. Anti-α-tubulin is shown as a loading control. N2: wild-type lysate, biological control without GFP::HCP-3. Numbers below the anti-GFP blot indicate the mean normalized GFP::HCP-3 level relative to the feeding RNAi control from three biological replicates (Fig. S4A). Positions of molecular mass markers are indicated on the right. (C) Top: diagram and representative fluorescence images showing the photobleaching assay used to investigate HCP-3 chromatin turnover in untreated and csr-1(RNAi) embryos expressing GFP::HCP-3 (green) and mCherry::H2B (red). GFP::HCP-3 on one of the anaphase sister chromatids was photobleached using a high-power laser with hand-drawn ROI (dashed ellipses), resulting in an unbleached (U) chromatid and a bleached (B) chromatid. In the next metaphase (next meta), the fluorescence intensities of the two daughter cells were measured (white arrowheads). The intensity ratio of the GFP signal for bleached over unbleached chromatin (B:U) was measured to quantify protein turnover on chromatin. The reappearing GFP signal on the bleached chromatin represents newly recruited GFP::HCP-3. Scale bar: 10 μm. Bottom left: quantification of the B:U ratio of the chromatin GFP::HCP-3 signal in untreated control embryos before (pre) and after (post) photobleaching in the first anaphase and in the next metaphase (next). Bottom right: the B:U ratio for untreated control and csr-1(RNAi) embryos in the next metaphase. Data are presented as mean±s.d. The n values shown represent the number of photobleached embryos analyzed. *P<0.05; ***P<0.001; ****P<0.0001; ns, not significant (two-tailed unpaired t-test).

