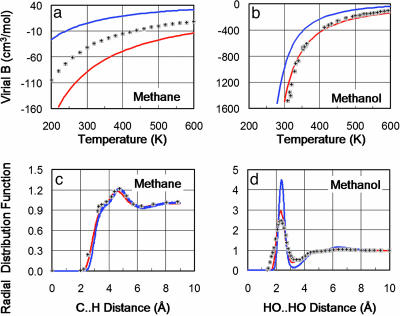
Fig. 4.
Comparison of QMPFF and MMFF94 with experimental data for methane and methanol in gas and condensed phases. The second virial coefficient characterizes the gas phase and is calculated as Bij = (1/2)∫〈1–e–Uij/kT〉ΩdR, where 〈...〉Ω denotes the averaging over molecular rotations; Uij is the interaction energy between the two molecules i, j; T is the temperature; and the integration is performed over the translational degrees of freedom. (a) For methane, the fit of B calculated for QMPFF (red line) to experiment (shaded plus signs) is no better than that of MMFF94 (blue line); these errors are partly due to insufficient accuracy of the QM calculations (dotted black line). (b) For methanol, QMPFF fits experiment much better than MMFF. (c) The radial distribution function, which characterizes the liquid phase, shows that both QMPFF and MMFF fit experiment well for methane. (d) For methanol, the QMPFF fit to experiment is clearly better than for MMFF. Liquids are simulated by using a box of 219 CH4 or 96 CH3OH molecules for 100 ps. For QMPFF, these simulations were slower by a factor of 15 than for MMFF.

