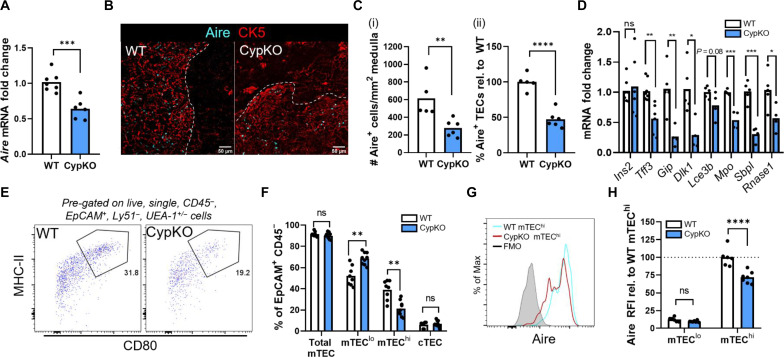
Fig. 2. Impaired mTEC differentiation and Aire expression in CypKO mice.
(A) qPCR detection of Aire mRNA expression in WT versus CypKO mice. (B and C) Zoomed-in IF microscopy images showing Aire + cells in WT versus CypKO thymi (B) and quantification from the entire thymic cross sections (C) (white dashed line denotes the cortico-medullary boundary). (D) qPCR detection of Aire-dependent TRA gene expression in WT versus CypKO thymi. (E) Representative flow cytometry plots of mTEChi cells (MHC-IIhi CD80+) in WT versus CypKO thymi. (F) Quantification of cTEC and mTEC frequencies in WT versus CypKO samples by flow cytometry. (G) Representative flow cytometry plot of Aire expression in WT versus CypKO mTEChi cells. (H) Quantification of Aire expression in mTEClo and mTEChi cells, relative to the average MFI of Aire in WT mTEChi cells. All experiments were performed with age-matched (male and female) 8- to 12-week-old mice. Each dot represents an individual mouse. Statistics: Unpaired parametric t tests. *P < 0.05; **P < 0.01; ***P < 0.001; ****P < 0.0001.

