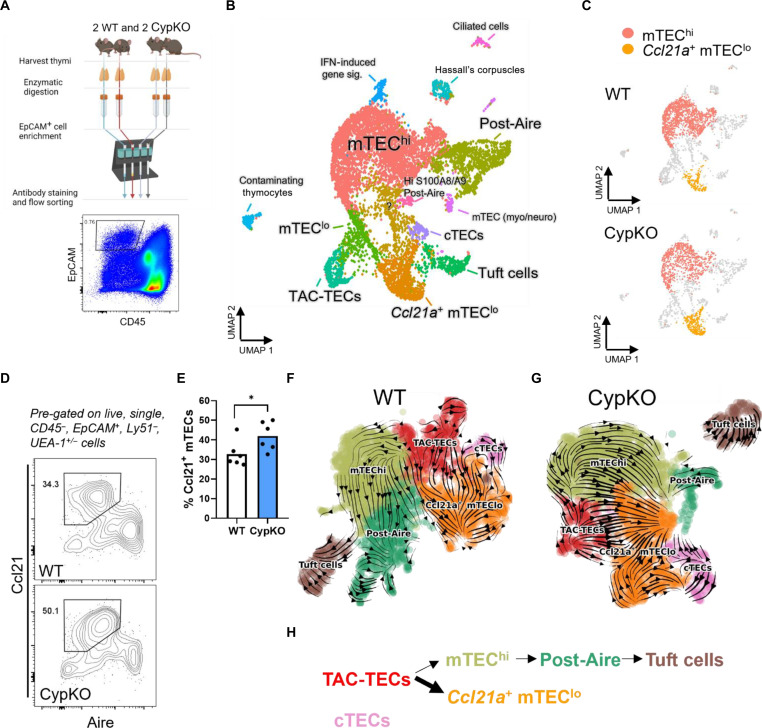
Fig. 6. Divergent mTEC differentiation in CypKO mice.
(A) Schematic of single-cell RNA-seq sample preparation from duplicate littermate mice. (B) Cluster annotation of integrated Seurat object containing all four samples, based on differential gene expression. IFN, interferon. (C) Comparison of WT and CypKO clusters densities; mTEChi and Ccl21a+ mTEClo are highlighted. (D and E) Validation of increased Ccl21+ mTECs in CypKO thymi by flow cytometry (D) and summary data (E). Each dot represents an individual mouse (age-matched, male and female). (F and G) RNA velocity plots of WT (F) and CypKO (G) samples; arrows point toward the direction of predicted differentiation based on RNA splicing dynamics. (H) Schematic of altered mTEC differentiation in CypKO mice. Statistics: Unpaired parametric t tests. *P < 0.05.

