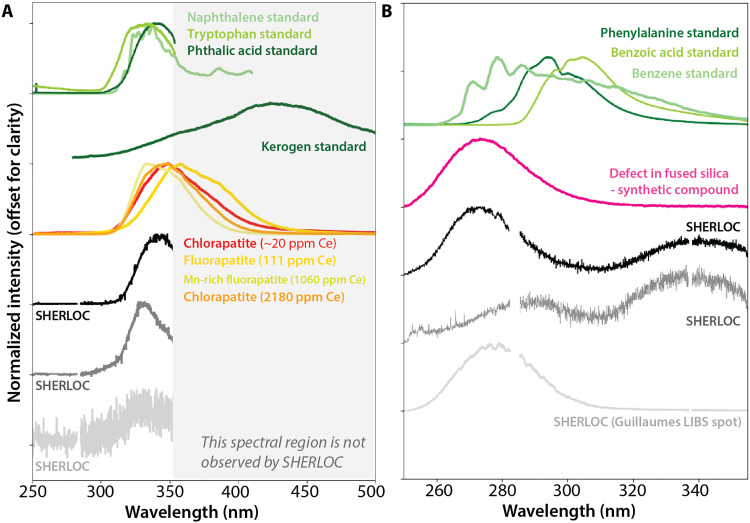
Fig. 1. Typical SHERLOC luminescence spectra from targets in the Jezero crater floor compared to standards.
(A) Examples of the 330- to 350-nm luminescence. Normalized SHERLOC spectra of 340-nm luminescence and 330-nm luminescence are shown in black and gray, respectively. Normalized laboratory spectra are shown in color: light to medium green denotes pure naphthalene (double ring aromatic), tryptophan (aromatic amino acid), and phthalic acid (aromatic dicarboxylic acid) [from (7)], dark green denotes terrestrial kerogen [from (41)], red denotes chlorapatite from meteorite NWA 10922 (Fig. 4), and yellow to orange shades denote natural apatite with 100 to 2200 ppm Ce from (8). The luminescence band intensity increases with Ce concentration (8). (B) Examples of the 270- to 290-nm luminescence. Black spectrum shows typical strong 270-nm luminescence, low in position for organic compounds, co-occurring with 340-nm luminescence. Dark gray spectrum shows 290-nm luminescence co-occurring with 340-nm luminescence. Light gray spectrum shows 280-nm luminescence from SuperCam LIBS spots in the Guillaumes rock target. Normalized laboratory spectra are shown in color: green line shows pure benzene, benzoic acid, and phenylalanine (aromatic amino acid) [from (7)], and pink shows spectra from oxygen vacancies in fused silica [first described in (42)]. Gaps in SHERLOC spectra represent detector overlap in two readout regions (4).

