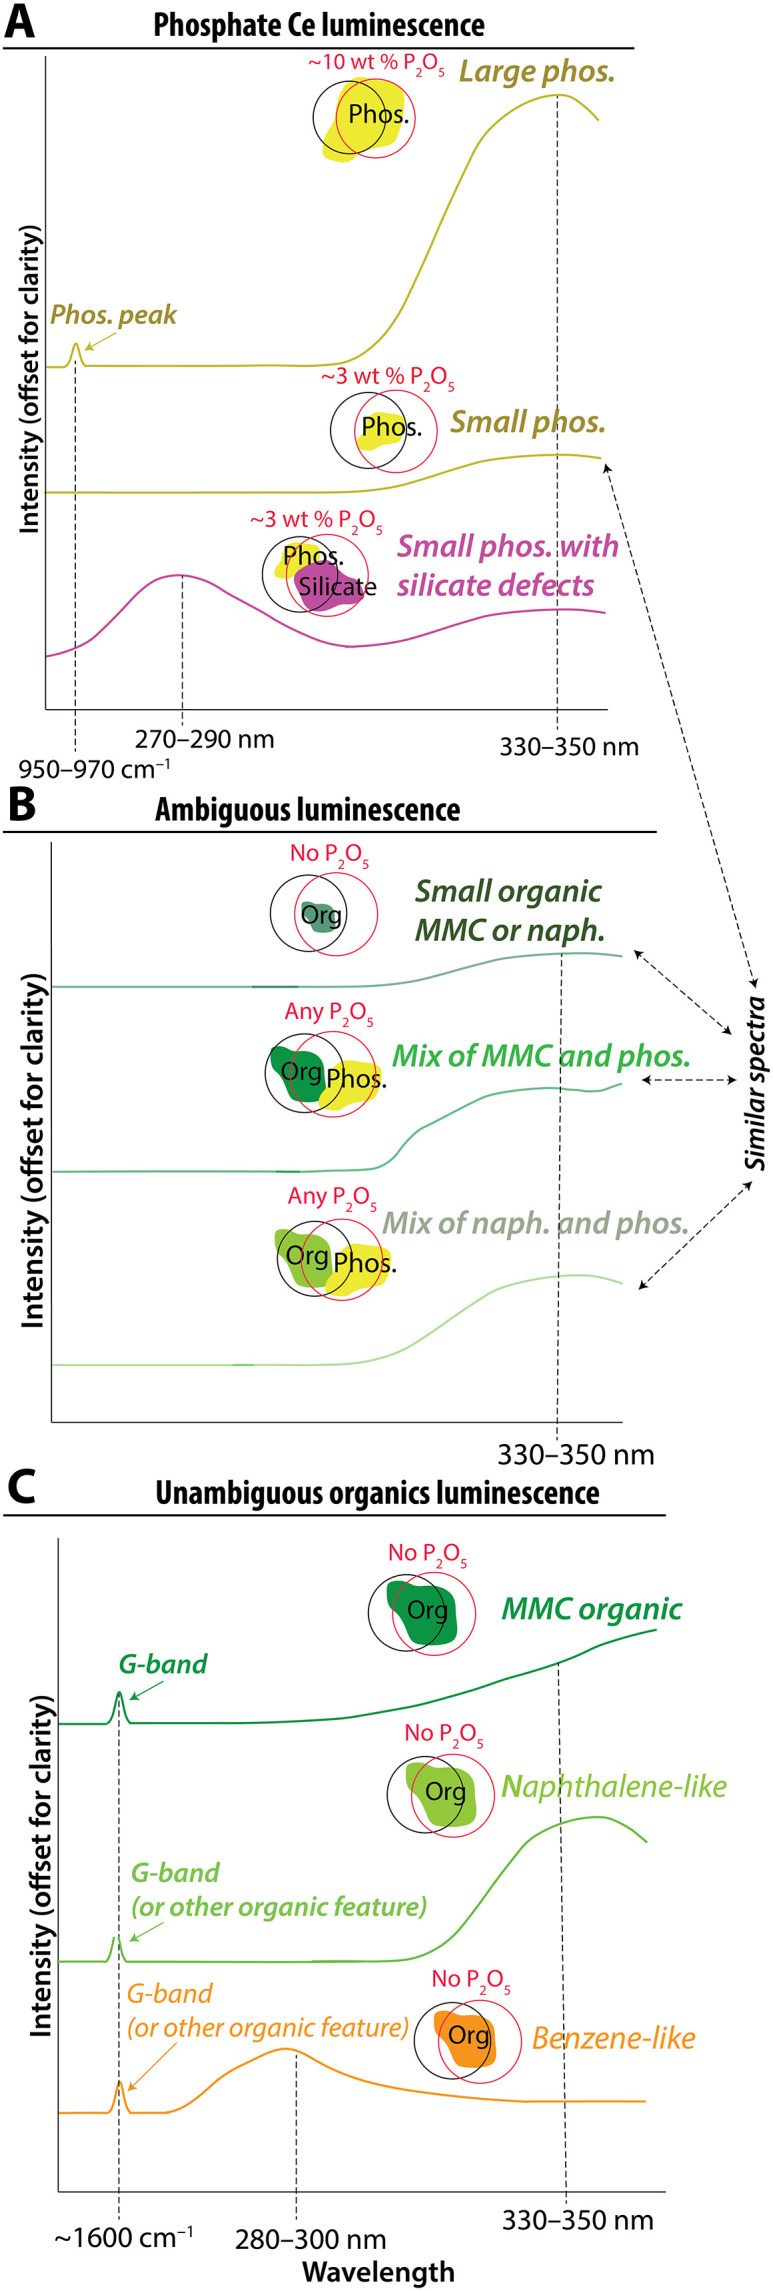
Fig. 2. Predicted observations from inorganic, organic, and ambiguous sources of 330- to 350-nm luminescence signals.

Cartoons illustrate potential sources of luminescence in the spot size of the SHERLOC laser and PIXL x-ray sources, including (A) inorganic sources, (B) ambiguous sources, and (C) unambiguous organic sources. These are idealized cartoon versions of spectra from Fig. 1 showing hypothesized changes in responses due to material volume covered by spot size and material mixtures. These spectra were not computed and are meant to function as hypotheses for spectral behavior. The intensity of the spectral signal can vary with material volume as represented by cartoons of phosphate minerals (yellow), other minerals (blue), and organics (green) in different sizes. Black and red circles illustrate surfaces measured by SHERLOC and PIXL, respectively; even when the two instruments target the same location on a rock, these footprints often do not perfectly overlap, such that they may sense different fractions of minerals. MMC, macromolecular carbon.
