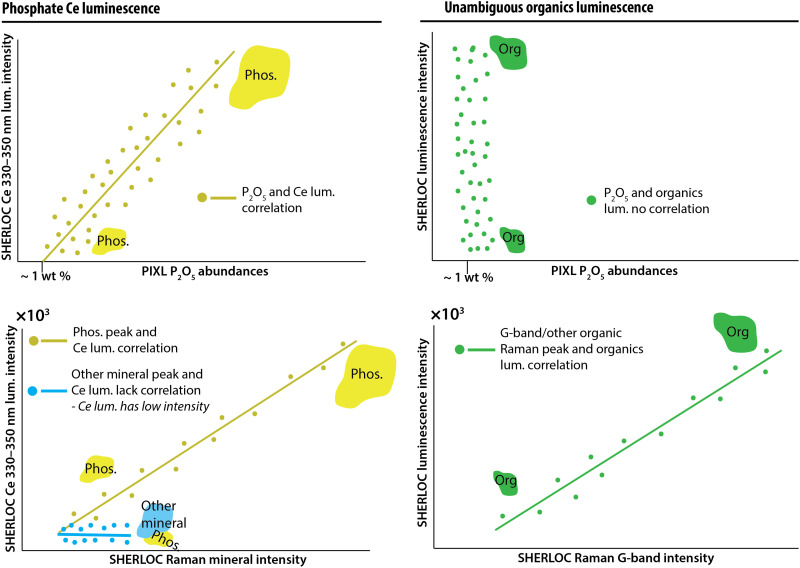
Fig. 3. Predicted relationships between SHERLOC luminescence, PIXL detections of elements, and SHERLOC Raman detections for minerals and organics.
Cartoons illustrate the anticipated relationships among signals from inorganic or organic sources. These spectra were not computed. Top row: The intensity of luminescence of Ce-bearing phosphate should correlate with the amount of PIXL-detected P2O5 (left). Likewise, if Ce is present in a mineral other than phosphate, we expect a correlation with compositional indicators of that phase (e.g., Ce-bearing sulfate luminescence should correlate with SO3 and defect luminescence should correlate with PIXL SiO2). The luminescence of organic material should not correlate with such measurements (right). These correlations could be driven by variation in the volumes of minerals within the instrument spot sizes as represented by cartoons of phosphate minerals (yellow), other minerals (blue), and organics (green) in different sizes. Bottom row: The intensity of Raman peaks of minerals that luminesce should correlate with the intensity of luminescence (left column). Unambiguous detection of organic luminescence would be accompanied by the detection of an organic Raman band (e.g., the G-band at ~1600 cm−1). The intensity of the organic luminescence band may correlate with the intensity of the organic Raman band due to changing volume of the organic material in the instrument spot sizes (right column).

