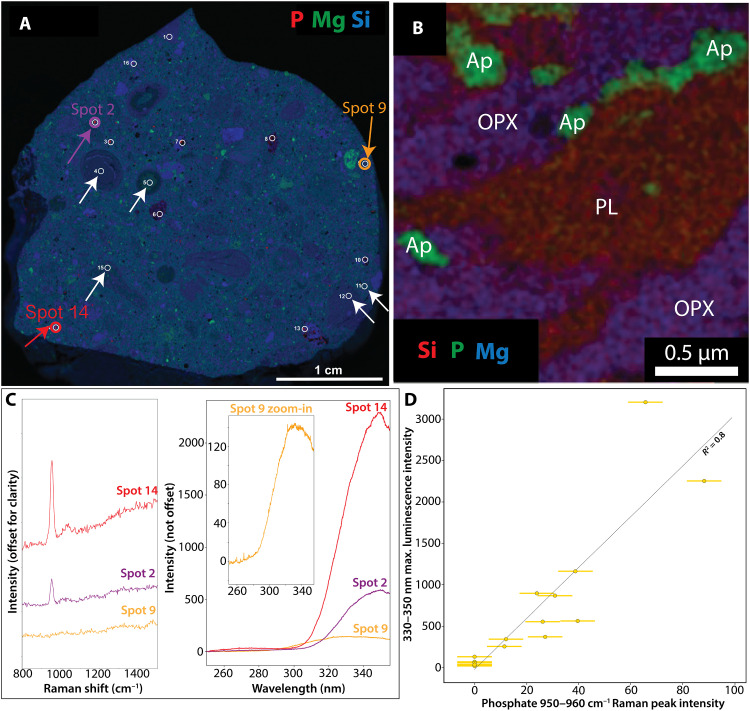
Fig. 4. Laboratory measurements of phosphate in martian meteorite NWA 10922.
(A) X-ray fluorescence composite map. Red color shows P abundance, green shows Mg abundance, and blue shows Si abundance. White circles outline areas analyzed by ACRONM. White arrows indicate matrix and clasts that contain nanometer-to-micrometer scale phosphate detectable by EDX-TEM only [shown in (B)]. Red, purple, and orange arrows (spots 2, 9, and 14) and circles show the location of spectra shown in (C) and (D). (B) Representative EDX-TEM image of nanometer-to-micrometer sized phosphates in the NWA 7034 (paired with NWA 10922) matrix (62). Red color shows Si abundance, green shows P abundance, and blue shows Mg abundance. (C) ACRONM Raman and luminescence spectra of phosphate grains (red and purple) and matrix material (orange). Note that Ce luminescence is stronger when the phosphate Raman peak is stronger and vice versa (red versus purple versus orange spectra). (D) Observed linear correlation between Ce luminescence and phosphate Raman peak intensities as predicted in Fig. 3. The luminescence has lower intensity when a phosphate Raman peak is weaker. Error bars are derived from the range of variation in pixel counts from scans in which no material is measured; note that luminescence error bars are smaller than symbols.

