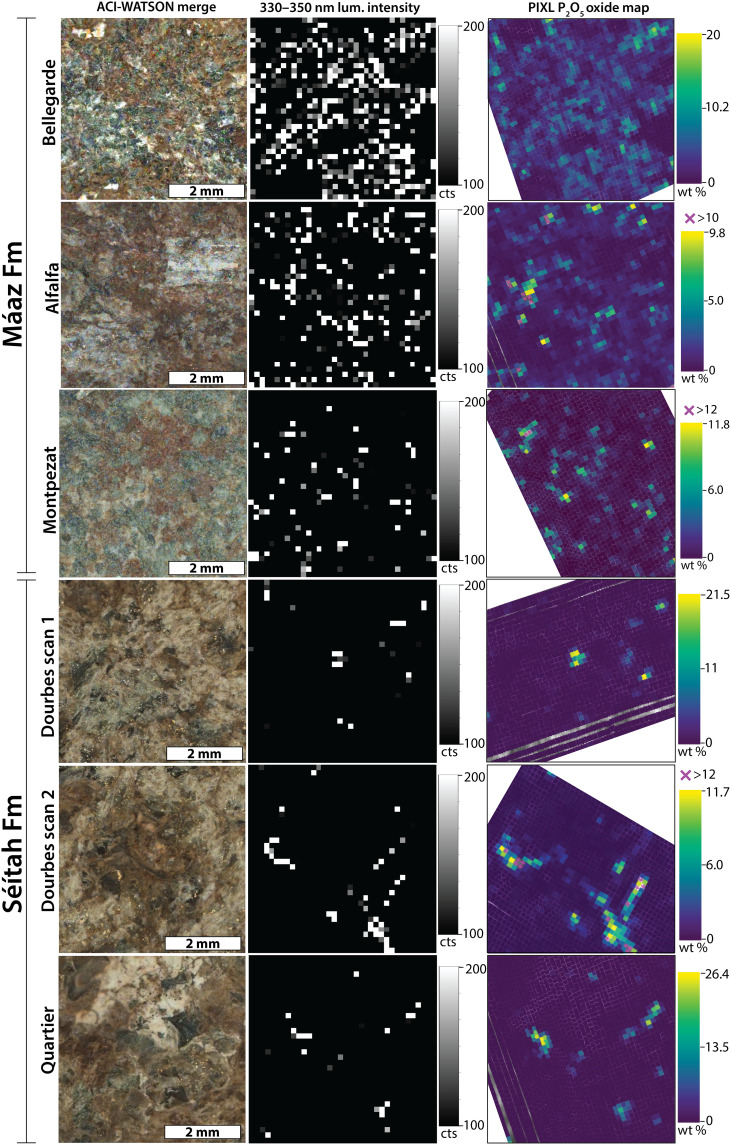
Fig. 5. Comparisons of SHERLOC and PIXL observations from the Jezero crater floor.
Left column: Colorized ACI-WATSON image merge products. Middle column: Maps of SHERLOC 330- to 350-nm luminescence intensity in counts (cts). Black color indicates no 330- to 350-nm luminescence above ~100 counts. Right column: Maps of PIXL P2O5 in wt %. Comparison of middle and right columns shows that luminescence and P2O5 hotspots correlate in rocks with both high and low P2O5 content.

