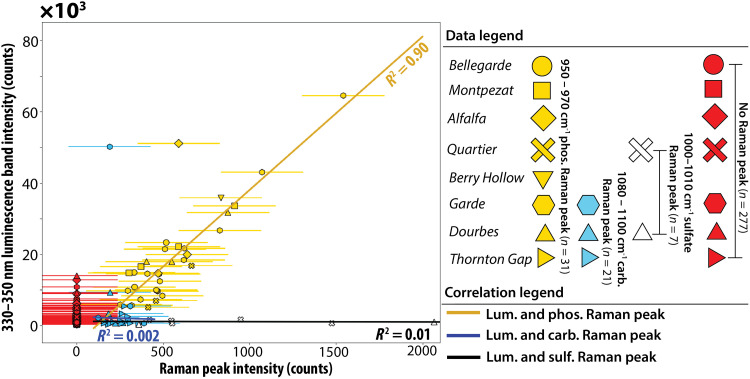
Fig. 7. Correlation of phosphate, carbonate, and sulfate Raman peak intensities with the intensity of 330- to 350-nm luminescence across the different rock targets.
Phosphate minerals (950 to 970 cm−1 Raman peaks; yellow) correlate with 330- to 350-nm luminescence, R2 = 0.90. Carbonate peaks (1080 to 1100 cm−1 Raman peaks; blue) and sulfate peaks (1010 to 1100 cm−1 Raman peaks; white) do not correlate with 330- to 350-nm luminescence (R2 ≤ 0.01). All carbonate and sulfate Raman peaks occur in points where the counts of the 330- to 350-nm luminescence are lower than 14,000 counts, except for one point in Garde. Error bars are derived from the range of variation in pixel counts from empty scans in which no material is measured (luminescence error bars are smaller than symbols).

