

Abstract
Global food prices rose substantially after the start of the COVID-19 pandemic. This paper examines the impact of rising food prices during the pandemic on food security in Burkina Faso. We aim to answer two primary questions. First, how do food price shocks affect household food insecurity? Second, what coping strategies do households adopt in response to these price shocks? Leveraging country-wide high-frequency longitudinal data, we employ household fixed effect models to examine the effects. In the absence of direct information on local food prices, we use household-reported price shocks to capture province-level price increases and show that the results are consistent with national-level price increases.
We find significant and immediate increases in food insecurity following the price shocks, and this effect persists for at least two months. The price shocks most acutely affected the poorest households. Furthermore, food insecurity increased more in rural areas than in urban areas. The higher proportion of poorer households in rural areas explains part of this difference. We find that households primarily cope with the shock by relying on increased assistance from relatives in Burkina Faso and abroad.
This study is the first to use panel data with household fixed effects to examine the repercussions of the rise in food prices during the pandemic on food insecurity in a developing country and to examine the coping mechanisms employed by households. Given that food prices are likely to remain high globally for an extended period, our findings carry implications for the broader developing world. Furthermore, given the disproportionate effect on the poorest and those living in rural areas, the findings highlight the need for policies to mitigate the negative impacts of the price shocks and enhance overall food security in countries like Burkina Faso.
Keywords: Food price, food insecurity, coping mechanisms, COVID-19, Burkina Faso
JEL Codes: Q18, E31, O12
1. Introduction
Global food prices have risen since the onset of the COVID-19 pandemic, but the impact of these price shocks on food insecurity remains poorly understood. This study examines the relationship between food price shocks and food insecurity using panel data from Burkina Faso. Burkina Faso is a particularly appropriate context for understanding the direct effects of price increases, as opposed to the combined effect of the pandemic, given the country’s high levels of food insecurity, with 40 percent of the population living below the poverty line, the relatively low levels of COVID-19 morbidity and mortality, and the absence of extended lockdowns (WFP, 2022).
The influence of food price inflation on food insecurity is theoretically ambiguous. On the one hand, higher food prices can exacerbate food insecurity among poor households. Poor households spend a substantial portion of their income on food, and when the cost of staple foods rises, they may struggle even further to afford an adequate and nutritious diet.
On the other hand, overall food insecurity may remain unchanged or even improve with increasing food prices if a significant proportion of the population are food producers. For example, subsistence farmers will likely be little affected by food price increases and remain at their, albeit already high, level of food insecurity. Furthermore, higher food prices may benefit poor households involved in agriculture by increasing their revenue from selling produce. Farmers may also be encouraged to invest more in agricultural activities when food prices rise. Finally, food price increases may stimulate demand for labor and increase wages in the agricultural sector, creating job opportunities for poor households relying on manual labor for their livelihoods (Dorward, 2012; Headey & Martin, 2016). These factors are potentially particularly relevant for Burkina Faso, where a significant fraction of the population lives in food-producing households.
Only a handful of prior studies examine the relationship between food price shocks and food insecurity, and consistent with the ambiguous theory, there is mixed evidence on the effects of food price increases on food insecurity. The majority of studies found an increased food insecurity (Akter & Basher, 2014; Compton et al., 2010; Dávila, 2010; D’Souza & Jolliffe, 2012; Hadley et al., 2011, 2012; Jacobs, 2010; Sophal, 2011). However, others found no change or even improvements in food security due to factors such as strong economic growth and potential benefits to sellers of food and workers involved in food production (Dorward, 2012; Headey, 2012, 2013; Verpoorten et al., 2013). Finally, there may be differential effects depending on the source of the food price increase. For example, a sudden increase in imported rice prices increased food insecurity in Nigeria, while increased domestic rice prices had an ambiguous effect (Amolegbe et al., 2021).
The current literature on food prices and food insecurity has three main limitations. First, previous studies focus predominately on the 2007–2008 world food price crisis.1 Unlike inflation explored in previous research, the pandemic triggered unprecedented events and distinctive challenges, such as widespread international lockdowns and disruptions to supply chains. Thus, the dynamics of food price increases during and after the pandemic and its effects on households may differ significantly from those observed in earlier studies on inflation driven by conventional macroeconomic issues. However, only two studies have examined the impact of rising food prices during the COVID-19 pandemic. Of those, one focused only on the first half of 2020, while the other analyzed the impact on dietary diversity rather than food insecurity per se (Erokhin & Gao, 2020; Madzorera et al., 2021).2
Second, most existing research uses cross-sectional data, raising concerns about the extent to which their findings are causal. This includes the more recent studies that focus on the COVID-19 pandemic. We found only two studies that employed panel data with estimation techniques like household fixed effects to control for time-invariant household characteristics that can help establish causal relationships and address endogeneity concerns (Akter & Basher, 2014; Amolegbe et al., 2021).
Finally, we know little about how households cope with food price increases. There is some evidence from studies using pre-pandemic data that households attempt to cope with rising food prices by reducing non-food spending, decreasing dietary diversity, utilizing savings and credit, selling assets, and seeking government assistance (Akter & Basher, 2014; Compton et al., 2010; D’Souza & Jolliffe, 2012; Hadley et al., 2012; Sophal, 2011). Yet, there is no empirical evidence on whether households employ other strategies often associated with households’ responses to shocks, such as migration, remittance, or financial assistance from family members within the country.
Our study contributes to the literature in three ways. We are the first study to use country-wide panel data to examine the impact of food price shocks on food insecurity during the COVID-19 pandemic. The panel data allows us to estimate plausibly causal relationships using a household fixed-effects model to control for unobservable household characteristics.
Second, we examine how households cope with food price shocks. Employing households’ reports on household member migration, remittance, assistance from family, and assistance from non-family individuals, we examine the specific channels households may use to cope with price shock. Examining these mechanisms is particularly important as there was a significant decline in global remittances and assistance received by households in developing countries in 2020 because lockdowns worldwide inhibited people’s ability to earn and send money (Alam et al., 2022).
Finally, by investigating how the pandemic-induced rise in food prices affected food insecurity, our study aims to provide insights into the distinctive challenges posed by this global pandemic. Specifically, as Burkina Faso did not have substantial lockdowns and few individuals tested positive for COVID-19, examining the knock-on effects of price increases that arose from other countries’ lockdowns contributes to our understanding of the costs and benefits of the global response to the COVID-19 pandemic.
We use household data from Burkina Faso that incorporated the Food and Agriculture Organization’s (FAO) food insecurity experience scale (FIES). This scale enables us to measure different severities of food insecurity. Instead of standard inflation measures, we create a measure of regional food price increases based on households’ self-reported experience of food price increases in the prior four weeks. Employing four rounds of data, spanning over a year, we compare changes in household food insecurity to variations in reported price shocks.
The main benefit of our regional price increase measure over the standard inflation measures is that it captures the shocks relevant to the households’ experiences and their area-specific food choices. For comparison, previous research that used regional price data has focused solely on the price changes of a single primary cereal, such as rice, maize, or wheat flour, within the specific country under investigation (Akter & Basher, 2014; Amolegbe et al., 2021; Dávila, 2010; D’Souza & Jolliffe, 2012). Focusing on one cereal can be problematic in a country like Burkina Faso, which has three main cereals, and the primary cereal varies by region. Such an approach hinders understanding potential substitution effects in response to price increases.
The downside of using reported shocks data is the potential for measurement error. Thus, we also examine the impact of national-level food price inflation on food insecurity from June 2020 to April 2023 and find results consistent with those for our primary shock measure. This suggests that our measure based on rapid phone survey data can be used to understand household responses to inflation in situations where there may be delays in obtaining price data and provide an early indicator to policymakers about the impact of inflation on households.
We find that increases in food prices led to an immediate and significant rise in food insecurity, including moderate and severe food insecurity. These effects persisted in the medium run, with food insecurity elevated one to two months after the initial price shock. The effect on food insecurity was significantly worse in rural areas compared to urban areas following the price shocks. Part of the reason for this effect is that the poor are more likely to live in rural areas, and poorer households were hit harder by the food price increase. We find that households cope with the price shock primarily through increases in financial assistance from both family members within the country and remittances from abroad. However, we find no evidence of individuals leaving the household following the price shock.
2. Burkina Faso
Burkina Faso is a landlocked West African country with a predominantly rural economy and a significant portion of the population employed in agriculture. The main crops include cotton, sorghum, millet, and maize. In addition to challenges in terms of food security and poverty, Burkina Faso has, in recent years, also faced security challenges due to the rise of armed extremist groups, particularly in the northern and eastern regions. These groups have attacked civilians, security forces, and infrastructure, leading to displacement and humanitarian crises.
Compared to many other developing countries, Burkina Faso allows us to isolate better the effects of food price increases on food insecurity during the COVID-19 pandemic. Burkina Faso experienced a relatively limited impact from the COVID-19 virus itself, with 17,632 confirmed cases and 318 deaths as of the end of 2021, which is low considering its population of approximately 22 million people (Mathieu et al., 2020). Furthermore, the lockdowns were much less onerous and short-lived than in other countries. The government implemented lockdown measures starting on March 21, 2020, including overnight curfews (7 pm to 5 am) and restrictions on public gatherings, including restaurants, cinemas, sports halls, and places of worship (Egger et al., 2022). The lockdowns were primarily applied in urban areas, meaning that market work in rural areas was not affected (Andrieu et al., 2021). The lockdowns were gradually eased from May 4, 2020, with most restrictions, including curfews, lifted by June 3, 2020 (Egger et al., 2022; USAID, 2020).
A more significant concern is the large internally displaced population resulting from violence. The ouster of President Blaise Compaore from office in 2014 left a power vacuum that worsened national security and caused Islamic militant groups to spread from the neighboring countries, Mali and Niger (IDMC, 2020; Lamarche, 2021). While their initial target was the government, they have been attacking civilians and trying to take control of communities since 2018 (Lamarche, 2021). To counter these threats, the government trained and financed militias, which worsened the crisis as these state-supported militias also started attacking civilians that they believed to be affiliated with insurgent groups. Attacks from both sides led to 519,000 newly displaced population in 2019 (IDMC, 2020). The displaced population reached a million by the end of 2020 and 1.5 million by 2021 (UN-OCHA, 2021b, 2022). Our robustness checks suggest that the internally displaced population does not bias our results.
3. Data
We use household data from the Burkina Faso High Frequency Phone Survey (HFPS), conducted by the World Bank and the National Institute of Statistics and Demography of Burkina Faso (World Bank, 2023). The survey was conducted monthly by phone over 17 rounds between June 2020 and April 2023. Each survey round was fielded over three weeks on average. The primary objective of the HFPS was to gain comprehensive insights into the impact of the COVID-19 pandemic on households by collecting frequent household-level data. In addition, the survey asked detailed questions on food insecurity, shocks, and outside assistance. The survey respondents were either the head of the household or any other knowledgeable adult household member.
The HFPS sample is a subsample of the 2018/19 Harmonized Living Conditions Household Survey (HLCHS), which interviewed 7010 households. Respondents in HLCHS 2018/19 were requested to provide a phone number, and 98% of households provided a number.3 The target sample size for the HFPS was 1,800 households to ensure a nationally representative sample. To account for potential non-response and attrition, a total of 2,500 households were called, of which 1,968 were successfully interviewed in round 1.
3.1. Food Insecurity Measures
The survey utilizes the Food Insecurity Experience Scale (FIES) developed by the FAO (FAO, 2016a) to measure food insecurity. FIES consists of eight questions with dichotomous (yes/no) responses that aim to capture the different challenges related to food insecurity. This measure has been empirically validated for cross-cultural use (Ballard et al., 2013; Kansiime et al., 2021). FIES asks whether, during the last 30 days, there was any time when any adult in the household experienced the following because of lack of money or other resources: (i) were worried about not having enough food to eat; (ii) were unable to eat healthy and nutritious/preferred foods; (iii) ate only a few kinds of foods; (iv) skipped a meal; (v) ate less than you thought you should; (vi) ran out of food; (vii) went hungry, but did not eat; and (viii) went without eating for a whole day.
Based on these eight questions, we create two binary food insecurity indicators following FAO guidelines (FAO, 2015; Kansiime et al., 2021). We first calculate a raw score by summing the responses to the eight questions using 1 for “yes” and 0 for “no.” A raw FIES score of 4 or greater corresponds to “moderate or severe”, and a score of 7 or greater corresponds to “severe” food insecurity.4 For both variables, 1 represents food insecurity and 0 otherwise.
Food security questions were included in survey rounds 2 through 7, 9 through 11, 13, 15, and 17. Additionally, questions on economic shocks were asked in rounds 2, 4, 6, 8, 10, and 16. For our analysis of the short-run relationship between price shocks and food security, we limit our analysis to rounds that contain both types of questions, specifically rounds 2, 4, 6, and 10. These survey rounds were conducted in July-August 2020 (round 2), November 2020 (round 4), January-February 2021 (round 6), and May-June 2021 (round 10), respectively. The attrition rate from round 2 to round 10 was 7 percent. The final sample size for the short-run analyses was 2,095 households. This includes replacement households added in later rounds.5
Furthermore, we analyze the medium-run impact by investigating the effect of shocks on food insecurity in the subsequent rounds. Specifically, we evaluate the influence of price shocks in rounds 2, 4, 6, and 10 on food insecurity in rounds 3, 5, 7, and 11, respectively.6 The time between the rounds with price shock information and those with food insecurity questions for the medium-run analyses was approximately one to two months, with the food insecurity surveys conducted in September 2020 (round 3), December 2020 (round 5), February 2021 (round 7), and July 2021 (round 11). The sample size for the medium-run analyses was 2,058 households.
3.2. Price Shock
HFPS collected information on shocks by asking households whether they were “negatively affected by the following problem over the past four weeks?” Response options included an increase in the price of the main food consumed, an increase in the price of inputs, a decrease in the selling price of production, poor harvest due to lack of manpower, rodent or insect infestation causing poor harvest, death of a household member, illness of a member, job loss, bankruptcy of non-agricultural business, and theft of property. The most reported shock was an increase in food prices, with 18 percent of households reporting this shock, on average, in each round. The next two most frequently reported shocks were the illness of household members (10.8 percent) and property theft (5.9 percent).
Given the potential for significant regional variations in prices over time due to poorly integrated markets, we use the percentage of households in each of the 45 provinces in Burkina Faso and each round that report food price shocks to capture the impact of the price increases. This allows us to observe the province-level variations in price shocks. We also use national-level year-over-year food price inflation data from the Food and Agriculture Organization (FAO) from June 2020 to April 2023 for sensitivity checks and to validate our price shock measure.7
3.3. Outside Assistance:
HFPS included questions on household assistance received from three sources: (i) remittance from abroad, (ii) family assistance from within the country, and (iii) help from other non-family people. Households were not asked about the monetary value of the assistance; instead, they were asked to indicate whether the assistance from each source had increased, remained the same, decreased, or had no assistance from that source compared to a year earlier. The study utilizes these ordinal variables to understand the extent to which households received external assistance in response to food price shocks. Each variable was coded such that 1 denotes an increase in assistance, 0 indicates remaining the same, or there was no assistance a year ago, and −1 represents a decrease.
Similarly, we can identify whether the number of household members increased, decreased, or remained the same compared to the last round. We create a similar ordinal variable (−1, 0, 1) identifying the direction of the change of household members.
3.4. Descriptive Statistics
Panel A of Table 1 presents the means of all food insecurity variables across the four rounds and by round. On average, 19.2 percent of households report moderate-or-severe food insecurity, and 5.9 percent report severe food insecurity each round. Panel B of Table 1 shows the frequency of food insecurity experienced by households over the four rounds. 42.3 percent of households experienced moderate-or-severe and 16 percent experienced severe food insecurity in at least one round.8
Table 1, Panel A:
Mean of food insecurity variables across four rounds
| Mean |
|||||
|---|---|---|---|---|---|
| Over four rounds | Round 2 | Round 4 | Round 6 | Round 10 | |
|
|
|||||
| Province-level shocks | 17.9% | 31.8% | 7.6% | 7.6% | 24.7% |
| Moderate-or-severe food insecurity | 19.2% | 31.1% | 19.6% | 13.7% | 12.3% |
| Severe food insecurity | 5.9% | 9.7% | 6.4% | 5.6% | 1.7% |
| Specific food insecurity questions | |||||
| Worry about not having enough food to eat | 47.2% | 55.9% | 48.8% | 40.2% | 43.7% |
| Unable to eat healthy and nutritious food | 35.1% | 44.5% | 37.5% | 32.1% | 26.2% |
| Had to eat only a few kinds of food | 42.2% | 48.6% | 43.6% | 38.5% | 38.0% |
| Had to skip a meal | 16.5% | 27.6% | 15.8% | 12.9% | 9.6% |
| Ate less than they thought they should | 23.3% | 35.6% | 23.2% | 15.7% | 18.3% |
| Ran out of food | 9.8% | 18.0% | 10.4% | 7.7% | 2.8% |
| Went hungry but did not eat | 10.8% | 17.7% | 11.8% | 7.9% | 5.7% |
| Went without eating for a whole day | 5.5% | 9.7% | 5.6% | 4.7% | 1.8% |
| No of observations | 7,933 | 1995 | 2010 | 1984 | 1944 |
Table 1, Panel B:
Frequency of insecurity experienced by households over four rounds
| Frequency of insecurity over four rounds |
||
|---|---|---|
| Number of rounds | Moderate or severe | Severe |
| 0 | 57.7% | 84.0% |
| 1 | 21.4% | 10.8% |
| 2 | 12.2% | 4.0% |
| 3 | 6.3% | 1.1% |
| 4 | 2.4% | 0.2% |
There are significant variations in the fraction of households that experienced food insecurity across rounds. In round 2, 31.8 percent of households reported experiencing an increase in the price of food in the prior four weeks, and 31.1 percent of households experienced moderate-or-severe food insecurity. In rounds 4 and 6, the percentage of households reporting a price shock decreased to 7.6 percent for both rounds and moderate-or-severe food insecurity decreased to 19.6 and 13.7, respectively. However, in round 10, there was a substantial increase in reported price shocks, with 24.7 percent of households reporting price increases, but food insecurity decreased to 12.3 percent.
This movement in price shocks is consistent with the national food prices changes in Burkina Faso. After staying below the five-year average throughout 2019, food prices significantly increased in June 2020 (ReliefWeb, 2021). Based on the national food price indices, the year-over-year food price inflation rate at the end of 2019 was −5.4%. However, there was a rapid and significant change by August 2020 (during round 2), where the food price inflation had increased to 7.2%. This elevated inflationary trend persisted for two more months before decreasing to 4.8% in February 2021, coinciding with the completion of round six. Subsequently, the food price inflation rate increased again to 7.4% by April 2021, just before the start of the last survey round in May.
The food price increase, driven primarily by disruptions in the supply chain, included the increases in the prices of main cereals, such as millet, sorghum, maize, and rice, of between 5 to 15 percent, depending on the market and region (ReliefWeb, 2021; World Bank, 2021).
To understand the correlation in price shocks between regions, we calculated the correlation coefficient in the food price shocks across all 45 provinces. The majority of province-pairs exhibit strong correlations of 0.8 or above. Nevertheless, close to half, 46 percent, of province-pairs show weaker correlations below 0.8, and 13 percent show weak correlations below 0.3. Notably, the lowest correlation coefficient is −0.867, observed between the Tapoa province by the eastern border and Sourou province in the northwest corner of Burkina Faso. These findings are consistent with prior research showing that many markets in developing countries are poorly integrated, particularly in Sub-Saharan Africa, due to high transportation costs, lack of information, weak infrastructure, and inefficient supply chains (Barrett, 2008; Fafchamps & Gavian, 1996; Moser et al., 2009; Ravallion, 1986).
4. Empirical Strategy
We use a conditional (household fixed effects) logit model for our estimations. Using the equation below, our main specification regresses outcomes, Y, on a set of variables.
| (1) |
where is the cumulative logistic distribution, denotes household, denotes a province, and survey rounds. is the percentage of households that report price shock in a province in a given round. We use this variation in reported price shocks to identify the impact on food insecurity, with the main coefficient of interest.
As there can be other time-varying shocks, the Other_shocks variables capture the other shocks reported by the households that may also affect food insecurity. We categorized these into five types of shocks: (i) health shock (includes illness, disability, or death of a household member), (ii) non-agricultural income loss (includes job loss and bankruptcy of non-agricultural business), (iii) loss of crop (includes poor harvest due to lack of manpower and rodent or insect infestation causing poor harvest), (iv) negative agricultural price shock (includes increases in the price of inputs and a decrease in the selling price of production), and (v) theft of property. Each of these five types of shocks is represented by a binary variable, taking the value 1 if the household experienced the shock, and 0 if they did not.
Roundt represents survey round indicator variables to control for seasonality. Agriculture in Burkina Faso is weather-dependent, with most farmers depending on a single season of rain-fed agriculture (Laudien et al., 2022; WFP, 2022). The primary cereal crops produced and consumed are sorghum, millet, and maize (Beal et al., 2023; Famine Early Warning System Network, 2017; Laudien et al., 2022). The harvest season for these crops typically spans from September through December (FAO, 2022; USAID, 2020; USDA, 2023), while the peak agricultural lean season, characterized by food scarcity, generally occurs from June to August (Action Against Hunger, 2021; USAID, 2022; WFP, 2023). Notably, the two rounds with the highest proportion of reported food price shocks—rounds 2 (July-August, 2020) and 10 (May-June, 2021)—coincided, at least partly, with the lean season. Thus, we include survey round indicators to control for the potential agricultural seasonality.
The household fixed-effects control for unobserved household-level time-invariant factors that may bias the results. This approach allows us to control for time-invariant characteristics associated with the individual/household, such as gender, race and religion, constant preferences, household characteristics, area characteristics, and other time-invariant factors.9
Furthermore, because we use ordinal variables to represent changes in household assistance and number of household members, we use a conditional fixed-effects ordered logistic model for those estimations. For the conditional ordered logit model, the actual values of the dependent variable are irrelevant. Instead, higher numbers correspond to higher-value outcomes (Baetschmann et al., 2015). Hence, for our regressions, a positive coefficient for food price shock represents an increase in assistance, a negative coefficient represents a decrease, and a coefficient close to zero implies that assistance remained unchanged.
5. Results
5.1. Short- and Medium-Run Effects
Table 2 shows the impact of reported food price increases in Burkina Faso on the likelihood of food insecurity in the short run. We present the odds ratio from the conditional logit model, which means that an odds ratio greater than 1 implies greater likelihood, and less than 1 implies lower likelihood. In columns 1 and 2, we show the impact of the food price increase after controlling for survey round dummies on food insecurity. The results indicate that the rise in food prices led to immediate, statistically significant increases in moderate-or-severe but no impact on severe food insecurity. In columns 3 and 4, we control for other shocks reported by the households that may also affect food insecurity. We find that the odds ratios of food price increases remain similar in size and statistically significant. The odds ratio of moderate-or-severe food insecurity is 1.009, implying that a 1 percentage point increase in reported price shock increases the odds of being moderate-or-severely food insecure by about 0.9 percent. Hence, a one-standard-deviation increase in reported regional food price—equivalent to a 17.2 percentage points increase in the proportion of households reporting a food price shock—would result in a 15.48 percent increase (17.2 × 0.9) in the odds of experiencing moderate-or-severe food insecurity. For context, the Sissili province witnessed the most substantial change in the fraction of households reporting a shock, a 69-percentage point change from round 2 to 4. This implies that the food price shock caused a 62 percent higher odds of being moderate or severely food insecure in that province.
Table 2:
Impact of regional food price increase on food insecurity in the short run
|
|
||||
|---|---|---|---|---|
| (1) | (2) | (3) | (4) | |
|
|
||||
| Levels of food insecurity | ||||
|
|
||||
| Outcome variables: | Moderate-or-severe | Severe | Moderate-or-severe | Severe |
|
|
||||
| Food price increase | 1.010** (0.004) |
1.007 (0.008) |
1.009** (0.004) |
1.007 (0.008) |
| Health shock | 0.929 (0.123) |
0.848 (0.191) |
||
| Non-agri. income loss | 2.497*** (0.494) |
1.672* (0.481) |
||
| Loss of crop | 1.529* (0.338) |
1.695* (0.494) |
||
| Theft of property | 1.202 (0.231) |
0.942 (0.287) |
||
| Negative agri. price shock | 1.009 (0.195) |
1.322 (0.441) |
||
| Round 4 dummy | 0.495*** (0.074) |
0.653* (0.164) |
0.512*** (0.078) |
0.670 (0.171) |
| Round 6 dummy | 0.258*** (0.039) |
0.520*** (0.129) |
0.275*** (0.043) |
0.555** (0.141) |
| Round 10 dummy | 0.177*** (0.020) |
0.102*** (0.024) |
0.201*** (0.024) |
0.111*** (0.027) |
| No of observations | 3,155 | 1,265 | 3,155 | 1,265 |
| Number of households | 808 | 324 | 808 | 324 |
Note: Conditional logit model. Odds ratio presented and standard errors are in parentheses.
indicates significance at 1% level
at 5%
at 10%. All dependent variables are dummy variables.
Table 3 presents the impact of shocks on food insecurity in the medium run, i.e., the effect in the following round. The results show that the food price shock significantly increases both moderate-or-severe and severe food insecurity in the medium run. The higher point estimates for both food insecurity measures in the medium run, compared to the short run, may indicate that households might have been able to better cope with the effects of the shock immediately after the shock, but as the rising prices continued, it became more painful for the households to ensure food insecurity,
Table 3:
Impact of regional food price increase on food insecurity in the medium run
|
|
||||
|---|---|---|---|---|
| (1) | (2) | (3) | (4) | |
|
|
||||
| Levels of food insecurity | ||||
|
|
||||
| Outcome variables: | Moderate-or-severe | Severe | Moderate-or-severe | Severe |
|
|
||||
| Food price increase | 1.012** (0.005) |
1.023** (0.009) |
1.012** (0.005) |
1.025*** (0.009) |
| Health shock | 0.706** (0.097) |
0.392*** (0.115) |
||
| Non-agri. income loss | 0.981 (0.197) |
0.498* (0.179) |
||
| Loss of crop | 1.105 (0.255) |
0.814 (0.279) |
||
| Theft of property | 1.110 (0.232) |
1.096 (0.384) |
||
| Negative agri. price shock | 1.327 (0.270) |
0.990 (0.341) |
||
| Round 4 dummy | 0.361*** (0.060) |
0.708 (0.203) |
0.369*** (0.063) |
0.655 (0.193) |
| Round 6 dummy | 0.352*** (0.057) |
0.423*** (0.122) |
0.359*** (0.059) |
0.394*** (0.117) |
| Round 10 dummy | 0.227*** (0.027) |
0.117*** (0.028) |
0.230*** (0.028) |
0.100*** (0.025) |
| No of observations | 2,684 | 1,010 | 2,684 | 1,010 |
| Number of households | 695 | 260 | 695 | 260 |
Note: Conditional logit model. Odds ratio presented and standard errors are in parentheses.
indicates significance at 1% level
at 5%
at 10%. All dependent variables are dummy variables.
5.2. Coping Mechanisms
Employing a conditional fixed-effects ordered logistic model, Table 4 examines how households tried to cope with the food price increase. Both remittances from abroad and family assistance from within the country rose significantly in response to the food price shock. Yet, there was no significant increase in help from non-family individuals or a change in the number of members living in the households.
Table 4:
Impact of food price increase on outside assistance and change in the number of household members
| (1) | (2) | (3) | (4) | |
|---|---|---|---|---|
|
|
||||
| Outcome variables: | Remittance | Family assistance within the country | Help from non-family people | Change in number of household members |
|
|
||||
| Food price increase | 1.037*** (0.011) |
1.022*** (0.005) |
1.000 (0.008) |
1.002 (0.004) |
| Health shock | 1.243 (0.368) |
1.533*** (0.230) |
1.344 (0.305) |
0.795* (0.102) |
| Non-agri. income loss | 1.697 (0.729) |
0.464*** (0.125) |
0.594 (0.207) |
0.956 (0.182) |
| Loss of crop | 0.325** (0.152) |
0.589* (0.187) |
0.926 (0.376) |
1.087 (0.251) |
| Theft of property | 0.713 (0.293) |
0.830 (0.184) |
1.085 (0.419) |
1.399* (0.267) |
| Negative agri. price shock | 0.596 (0.191) |
0.857 (0.210) |
0.607 (0.217) |
0.944 (0.171) |
| Round dummies | Yes | Yes | Yes | Yes |
| No of observations | 661 | 1989 | 748 | 3472 |
| Number of households | 169 | 509 | 190 | 888 |
Note: All columns represent odds ratio from fixed effects ordered logit model, so for the dependent variables, 0 represents no change, 1 represents an increase, and −1 represents a decrease. Standard errors are in parentheses.
indicates significance at 1% level
at 5%
at 10%.
5.3. Heterogeneity in Effects
The literature suggests that there may be differences in effects between urban and rural areas (Dávila, 2010; Hadley et al., 2011; Verpoorten et al., 2013). However, there is no clear consensus on the direction. Some studies find that households in urban areas were better off than rural areas following food price shocks, primarily because wealthier households are more likely to live in urban areas (Dávila, 2010; Hadley et al., 2011). However, a multi-country study found that food security was better for rural households than urban households (Verpoorten et al., 2013). The reason behind the differences in findings across studies is unclear.
To explore potential differences in the effects of food price shocks between rural and urban areas, we create an indicator variable for rural areas, where 1 represents rural and 0 represents urban. We interact the rural variable with the variable representing a rise in food prices. The results are presented in Table 5.10 Rural areas are significantly more likely to experience an increase in food insecurity in the short run from price increases than urban areas for both moderate-or-severe and severe food insecurity. The point estimates for both food insecurity measures indicate a sizeable urban-rural difference: a standard deviation increase in reported regional food price shocks would lead to a 43 percent greater increase in the odds of moderate-or-severe food insecurity in rural areas than in urban areas.
Table 5 Panel A:
Differences in effect between rural and urban areas of food price increase on food insecurity
|
|
||
|---|---|---|
| (1) | (2) | |
|
|
||
| Level of food insecurity | ||
|
|
||
| Outcome variables: | Moderate-or-severe | Severe |
| Food price increase | 0.998 (0.005) |
1.000 (0.008) |
| Food price increase x Rural | 1.025*** (0.006) |
1.023** (0.009) |
| Health shock | 0.937 (0.125) |
0.811 (0.187) |
| Non-agricultural income loss | 2.387*** (0.475) |
1.589 (0.460) |
| Loss of crop | 1.551* (0.351) |
1.749* (0.521) |
| Theft of property | 1.164 (0.225) |
0.913 (0.282) |
| Negative agricultural price shock | 0.947 (0.186) |
1.219 (0.415) |
| Round dummies | Yes | Yes |
| No of observations | 3,155 | 1,265 |
| Number of households | 808 | 324 |
Note: Conditional logit model. Odds ratio presented and standard errors are in parentheses.
indicates significance at 1% level
at 5%
at 10%. All dependent variables are dummy variables.
To better understand the reasons behind the greater food insecurity in rural areas following a food price increase, we examined whether this was due to a higher proportion of poorer individuals living there. We used household wealth information from the survey round before the pandemic to explore this possibility. We sorted households by wealth and grouped them into four quartiles, from the highest to the lowest. As shown in Panel B of Table 5, a higher proportion of poorer households were in rural areas. Specifically, 84% of households in the lowest wealth quartile lived in rural areas, compared to only 26.8% in the highest wealth quartile.
Table 5, Panel B:
Percentage of individuals living in rural areas in different wealth groups
| Percentage living in rural areas |
|
|---|---|
| Lowest wealth quartile | 84.0% |
| Second-lowest wealth quartile | 78.0% |
| Second-highest wealth quartile | 59.9% |
| Highest wealth quartile | 26.8% |
We show the differential impact of food price shocks on food insecurity across different wealth groups in Table 6. We interact food insecurity with each wealth quartile, where the lowest wealth quantile served as the excluded group. The odds ratio of the interaction term for the highest wealth quartile is less than one and statistically significant for both food insecurity measures. This indicates that households in the highest wealth quartile were significantly less likely to experience food insecurity than the poorest group following the food price shocks. The odds ratio suggests a sizeable impact: a standard deviation increase in reported regional food price shocks would lead to a 50.3 percent lower odds of food insecurity for the wealthiest than the poorest quartile. While the odds ratio is also less than one for the second-highest wealth quartiles, the effects are not statistically significant. Overall, the results suggest that the wealthiest quartile of households were most likely to be able to avoid food insecurity because of rising prices.
Table 6:
Differences in effect of regional food price increase by different asset quartiles on food insecurity
|
|
||
|---|---|---|
| (1) | (2) | |
|
|
||
| Level of food insecurity | ||
|
|
||
| Outcome variables: | Moderate-or-severe | Severe |
| Food price increase | 1.009* (0.005) |
1.010 (0.010) |
| Food price inc. x Second Lowest Wealth | 1.008 (0.006) |
1.012 (0.011) |
| Food price inc. x Second Highest Wealth | 0.989 (0.007) |
0.985 (0.011) |
| Food price inc. x Highest Wealth | 0.982** (0.008) |
0.960*** (0.013) |
| Health shock | 0.930 (0.124) |
0.864 (0.196) |
| Non-agricultural income loss | 2.490*** (0.495) |
1.457 (0.429) |
| Loss of crop | 1.506* (0.336) |
1.639* (0.488) |
| Theft of property | 1.233 (0.239) |
0.951 (0.295) |
| Negative agricultural price shock | 1.008 (0.196) |
1.395 (0.473) |
| Round dummies | Yes | Yes |
| No of observations | 3,155 | 1,265 |
| Number of households | 808 | 324 |
Note: Conditional logit model. Odds ratio presented and standard errors are in parentheses.
indicates significance at 1% level
at 5%
at 10%. All dependent variables are dummy variables.
As the wealth data is self-reported, there can be measurement errors that may bias the results. While the survey does not have household income data, we can use the education of the household head as a proxy for income and wealth. To explore the relationship between education level and food insecurity, we create a dummy variable where 1 represents households with heads who had finished at least primary school and 0 for households with heads who had not. In Table 7, we then interact the food price increase variable with the primary school completion dummy variable. Our findings indicate that households with heads who completed at least primary school were significantly less likely to experience both types of food insecurity. These results suggest that more education, likely a proxy for higher income and wealth, provides better protection against food insecurity.
Table 7:
Differences in effect of regional food price increase by education on food insecurity
|
|
||
|---|---|---|
| (1) | (2) | |
|
|
||
| Level of food insecurity | ||
|
|
||
| Outcome variables: | Moderate-or-severe | Severe |
| Food price increase | 1.012** (0.005) |
1.013 (0.008) |
| Food price increase x Primary school | 0.989* (0.005) |
0.980** (0.008) |
| Health shock | 0.942 (0.125) |
0.888 (0.201) |
| Non-agricultural income loss | 2.498*** (0.495) |
1.681* (0.486) |
| Loss of crop | 1.526* (0.338) |
1.666* (0.488) |
| Theft of property | 1.189 (0.229) |
0.901 (0.276) |
| Negative agricultural price shock | 0.986 (0.191) |
1.296 (0.435) |
| Round dummies | Yes | Yes |
| No of observations | 3,155 | 1,265 |
| Number of households | 808 | 324 |
Note: Conditional logit model. Odds ratio presented and standard errors are in parentheses.
indicates significance at 1% level
at 5%
at 10%. All dependent variables are dummy variables.
It is plausible that there exist heterogeneities among agricultural households in rural areas based on whether they are net food producers or not. However, the HFPS lacks data on the food production of households. Although the HLCHS 2018/19, conducted a year before the onset of the pandemic, captures information on households’ food production, it does not include questions that allow us to identify households as net food producers or subsistence households. Consequently, we cannot conduct a heterogeneity analysis based on net food-producing households.
6. Robustness Checks
6.1. Measurement Error in Reported Price Shocks
Our price shock variable is based on the households’ self-reports of increases in food price increases during the prior month. However, there may be potential measurement errors in these self-reported data.11 To address this concern, we introduce an alternate measure of price shock using national monthly food price inflation data from the FAO. In Table 8, we show the impact of national year-over-year food price inflation in the prior calendar month on food insecurity using all rounds with food insecurity information, i.e. rounds 2, 3, 4, 5, 6, 7, 9, 10, 11, 13, 15, and 17, covering June 2020 to April 2023. This food price inflation data is particularly useful for our analysis because there were significant increases in food prices in 2022 and 2023, with the year-over-year food price inflation reaching as high as 32 percent in mid-2022. We find that food price inflation significantly increases both types of food insecurity. There are two caveats to this analysis. First, we cannot control for other shocks in this estimation because of the lack of shock data in several rounds. Second, by round 17 (April 2023), the attrition rate for the sample was high at 26.9 percent, which may bias the estimates. With these caveats, the results support our earlier results, indicating that the impact of rising food prices on food insecurity remains robust even when using an alternative measure based on national food prices. The results remain robust if we include lean season indicator variable, where 1 represents the lean season which are the months of June, July, and August, and 0 represents not a lean season. The results are presented in columns 3 and 4 of Table 8.
Table 8:
Effect of food price inflation on food insecurity
|
|
||||
|---|---|---|---|---|
| (1) | (2) | (3) | (4) | |
|
|
||||
| Level of food insecurity | ||||
|
|
||||
| Outcome variables: | Moderate-or-severe | Severe | Moderate-or-severe | Severe |
|
|
||||
| Food price inflation | 1.037*** (0.003) |
1.013*** (0.005) |
1.036*** (0.003) |
1.013*** (0.005) |
| Lean season dummy | 1.387*** (0.060) |
0.989 (0.072) |
||
| No of observations | 14,034 | 5,863 | 14,034 | 5,863 |
| Number of households | 1,312 | 541 | 1,312 | 541 |
Note: Conditional logit model. Odds ratio presented and standard errors are in parentheses.
indicates significance at 1% level
at 5%
at 10%. All dependent variables are dummy variables.
6.2. COVID-19 prevalence
In addition to a food price increase, individuals may be ill, decide to self-isolate, or take other steps to avoid contact with others if they perceive a high risk of contracting COVID-19, which may also affect food insecurity. For context, the fraction of the population who tested positive for COVID-19 in Burkina Faso is significantly lower than elsewhere in Africa. The cumulative number who have tested positive in Burkina Faso stood at less than 100 per 100,000 in December 2023. For comparison, the corresponding numbers are over 600 for Kenya, over 500 for Ghana, and 350 for Uganda. The closest is Mali at approximately 150 per 100,000.
To capture the severity of the COVID-19 situation, we add the number of new COVID-19 cases per 100,000 persons nationwide during the 30 days before the household’s survey date as an additional variable. The number of COVID-19 cases comes from “Our World in Data.”12 As shown in Appendix Table A2, our results remain robust as the odds ratios of the main results remain similar in magnitude and have the same statistical significance.
6.3. Conflict
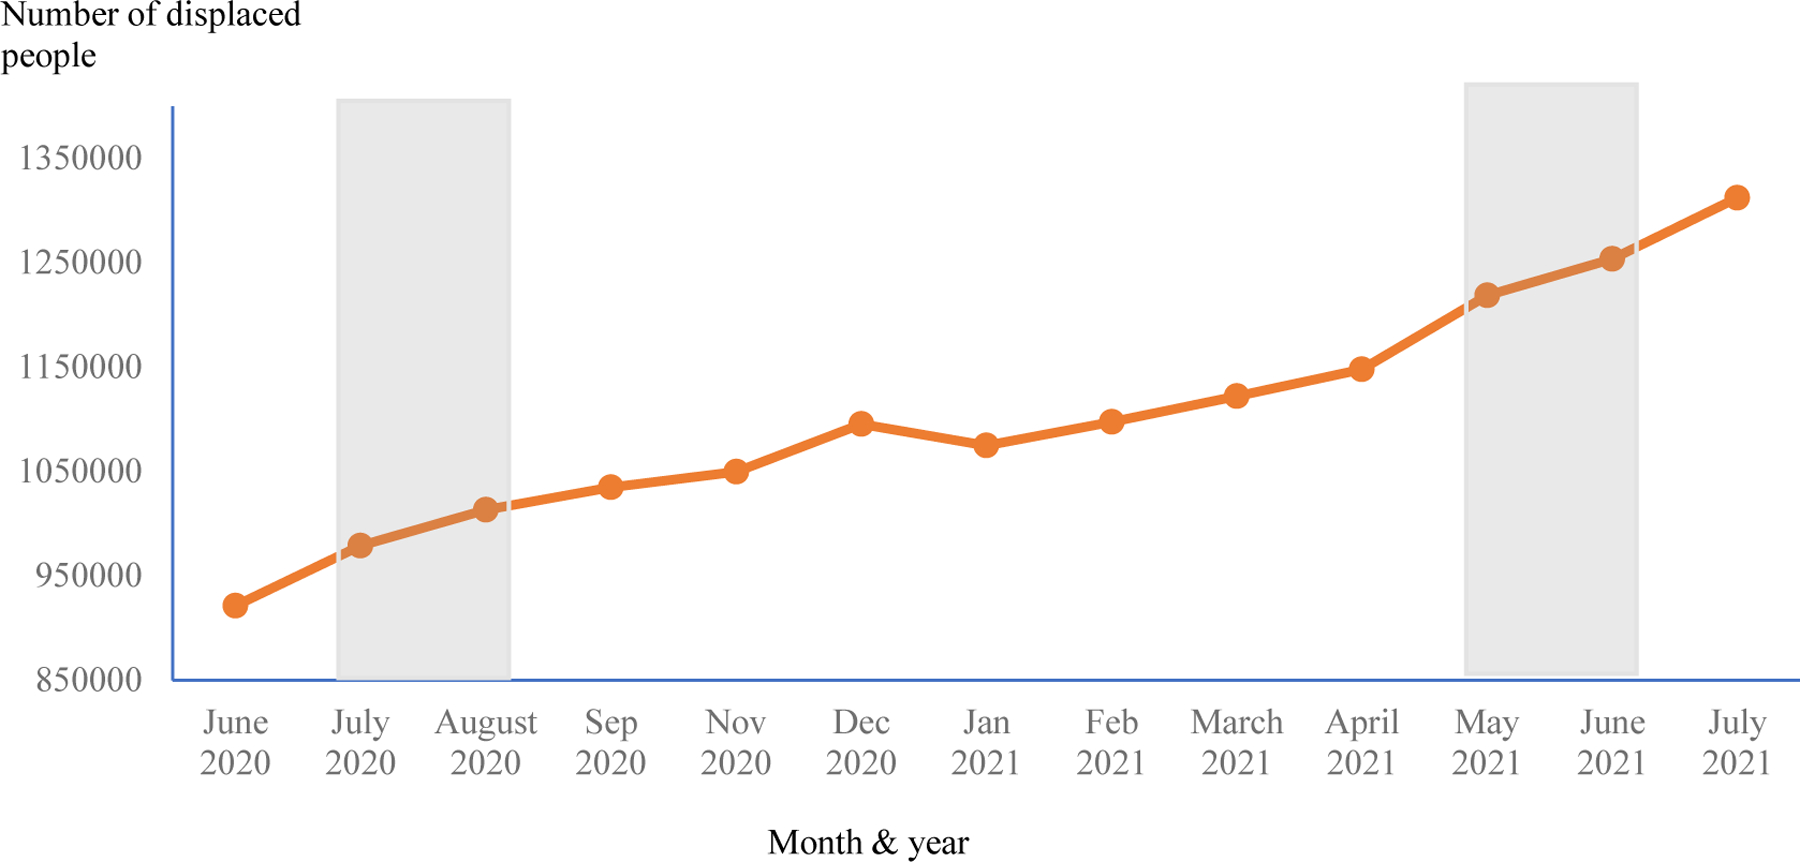
A further concern is whether the observed increases in food prices and food insecurity during rounds 2 and 10 are driven by the migration of internally displaced people. To address this concern, we conducted a series of robustness checks.
First, we analyzed data from UNHCR and plotted the total number of displaced individuals by month in Appendix Figure A1 (UNHCR, 2023). We highlight the months corresponding to the survey rounds with high reported food price increases in gray. Our analysis reveals no evidence of a sudden increase in the displaced population coinciding with the food price increases in rounds 2 and 10.
Most of the displaced population, over 70 percent, originated from the two northern regions of Sahel and Central-North (UN-OCHA, 2021b, 2022). Most displaced people moved to nearby provinces within the same region or, in some cases, neighboring regions (UNHCR, 2021; UN-OCHA, 2021a, 2021c). Considering that the origin and destination regions of the displaced people are often the same, we examine whether the two regions with the most displaced people were driving the regional food price shocks and contributing to higher food insecurity. Hence, as a robustness check, we exclude households residing in these two regions and estimate the impact of price shocks on food insecurity using the remaining sample. Although this reduces our sample size by approximately 11 percent, affecting statistical power and potential variation in price shocks, the results presented in Appendix Table A3 show that the coefficients of price shocks remain statistically significant, and odds ratio remain qualitatively similar for both food insecurity measures. Hence, our findings suggest that the high displacement regions do not significantly influence the impact of price shocks.
Displaced people also appeared more likely to move to urban areas (UNHCR, 2021). We provide three pieces of evidence that indicate that this is unlikely to bias our results. First, our earlier results indicated that the higher wealth of households was the main driving factor behind the better food security of urban households compared to rural ones following the food price shock.
Second, since most displaced people move to urban areas, food prices in urban areas may be more affected by increased demand, making households originally residing in urban areas systematically more likely to report food price shocks. Nonetheless, we find that, on average, 18.4 percent of households in rural areas reported a food price shock per round. In comparison, 17.6 percent of households in urban areas reported the shock. In other words, households in urban areas were slightly less likely to experience food price shocks.
Third, suppose that most displaced people move to urban areas and cause a change in both food prices and food insecurity. In that case, bias in estimations that include urban areas is possible. Thus, estimations focusing only on rural areas may provide more precise results. As shown in Appendix Table A4, our results remain robust when limiting our analysis only to rural areas.
6.4. Attrition
The attrition rate from round 2 to 10 was 7 percent, which is relatively low in the context of phone surveys. We estimate three alternative models to assess potential bias introduced by non-random attrition from our sample. First, we investigated whether food price shocks contribute to households dropping out of the sample. The results, shown in Appendix Table A5, indicate that individual food price shocks reported in the current round decrease the likelihood of attrition in the following round.
Second, we conduct a bounding exercise to assess potential attrition bias. In this exercise, we make two extreme assumptions: either all households that dropped out were consistently food secure, or all were consistently food insecure in the missing rounds. The main estimations were then rerun under these assumptions while including those missing rounds. The findings, detailed in Appendix Table A6, demonstrate that our results remain robust under both assumptions.
Third, we compare our main estimates to (i) a balanced sample, where households appear in all four rounds, and to (ii) a sample that excluded households that left the survey but included households that were added following round 2 and did not subsequently leave the survey.13 There are limitations in both approaches. First, limiting the sample to households present in all rounds may introduce selection bias, as more vulnerable or food-insecure households might drop out while less vulnerable ones remain, skewing our estimates downward. Second, as households left the sample, new households were added in subsequent rounds by HFPS surveyors to maintain national representativeness. Dropping those added households to create a balanced panel would make the sample no longer nationally representative.
With these caveats, we conduct our estimations for the two comparison samples. The results are presented in Appendix Table A7. Our findings indicate that the majority of our estimates, both short-run and medium-run, remain statistically significant, with the exception of one result: the short-run impact on moderate-or-severe insecurity where households appear in the balanced panel. While the direction of this result remains consistent, it becomes statistically insignificant. We attribute this partly to the smaller sample sizes in these restricted samples, and partly to the selection bias arising from sample restrictions.
Overall, all three of our robustness tests suggest that non-random attrition is not a substantial issue for our estimations.
7. Conclusion
This is the first study to use panel data to examine the impact of the rising food prices during the COVID-19 pandemic on food insecurity. Using nationally representative data from Burkina Faso, we show that a surge in reported food prices substantially heightens the risk of food insecurity, with the effects persisting up to two months after the shock. We find that households rely on remittance from abroad and family assistance from within the country to cope with the effects of the price shock
The study reveals a considerable variation in the effects of food price shocks. Food insecurity is more prevalent in rural areas than urban ones, likely due to a higher percentage of lower-income households residing in rural settings. Furthermore, we found that wealthier households are significantly less susceptible to food insecurity in the wake of food price shocks, highlighting the crucial role of wealth in buffering these effects.
Recommendations for future research include several key areas. First, investigating the long-term effects of rising food prices on food insecurity and coping mechanisms will provide insights into sustained impacts. Second, assessing the effectiveness of policy interventions to mitigate the negative consequences of food price shocks is essential. Evaluating existing programs and proposing strategies to enhance household resilience and equitable access to nutritious food during price volatility is crucial. Finally, the literature suggests that economic shocks can have different effects based on the gender of both adults and children (Alam, 2015; Pitt & Rosenzweig, 1990; Rose, 2000). Consequently, exploring the gender-specific impacts of food price shocks on food insecurity and household coping strategies can help identify those most affected by such shocks.
This study’s findings underscore food insecurity’s complex nature and the significant impact of food price shocks. It highlights the need for policies focused on food price stability and addressing wealth disparities. Such policies can help to buffer the negative impacts of food price shocks and enhance overall food security in countries like Burkina Faso. Finally, the results add to our understanding of the negative impact of the pandemic and the global lockdowns, even for countries otherwise little affected by COVID-19.
Declaration of generative AI and AI-assisted technologies in the writing process
During the preparation of this work the authors used ChatGPT in order to help with grammar and clarity in the writing. After using this tool/service, the authors reviewed and edited the content as needed and take full responsibility for the content of the publication.
APPENDIX
Figure A1:
Total number of displaced people by month
Table A1:
Frequency of each food insecurity experienced by households over four rounds
| Frequency of different kinds of insecurities over four rounds |
||||
|---|---|---|---|---|
| Number of rounds | Worry about not having enough food to eat | Unable to eat healthy and nutritious food | Had to eat only a few kinds of food | Had to skip a meal |
| 0 | 21.1% | 38.2% | 29.9% | 61.1% |
| 1 | 22.5% | 23.3% | 21.5% | 22.5% |
| 2 | 23.8% | 15.2% | 19.4% | 10.3% |
| 3 | 20.4% | 12.6% | 16.2% | 4.5% |
| 4 | 12.2% | 10.6% | 13.0% | 1.7% |
| Number of rounds | Ate less than they thought they should | Ran out of food | Went hungry but did not eat | Went without eating for a whole day |
|---|---|---|---|---|
| 0 | 50.9% | 73.3% | 72.9% | 84.6% |
| 1 | 24.0% | 18.4% | 16.9% | 11.1% |
| 2 | 13.7% | 6.3% | 6.8% | 3.2% |
| 3 | 8.1% | 1.7% | 2.8% | 1.1% |
| 4 | 3.3% | 0.3% | 0.6% | 0.0% |
Table A2:
Impact of regional food price increase on food insecurity in the short run after controlling for COVID-19 cases
|
|
||
|---|---|---|
| (1) | (2) | |
|
|
||
| Level of food insecurity |
||
| Outcome variables: | Moderate-or-severe | Severe |
|
|
||
| Food price increase | 1.009** (0.004) |
1.008 (0.008) |
| Health shock | 0.925 (0.123) |
0.838 (0.190) |
| Non-agri. income loss | 2.483*** (0.492) |
1.676* (0.485) |
| Loss of crop | 1.510* (0.335) |
1.622 (0.478) |
| Theft of property | 1.210 (0.234) |
0.932 (0.285) |
| Negative agri. price shock | 0.997 (0.194) |
1.310 (0.442) |
| COVID-19 cases/100,000 | 0.669*** (0.080) |
0.644** (0.112) |
| Round dummies | Yes | Yes |
| No of observations | 3,155 | 1,265 |
| Number of households | 808 | 324 |
Note: Conditional logit model. Odds ratio presented and standard errors are in parentheses.
indicates significance at 1% level
at 5%
at 10%. All dependent variables are dummy variables.
Table A3:
Impact of regional food price increase on food insecurity in the short run after dropping areas most affected by conflict
|
|
||
|---|---|---|
| (1) | (2) | |
|
|
||
| Level of food insecurity |
||
| Outcome variables: | Moderate-or-severe | Severe |
|
|
||
| Food price increase | 1.012** (0.005) |
1.012 (0.009) |
| Health shock | 0.967 (0.140) |
0.827 (0.207) |
| Non-agri. income loss | 2.858*** (0.619) |
1.790* (0.559) |
| Loss of crop | 1.494* (0.344) |
1.748* (0.522) |
| Theft of property | 1.139 (0.237) |
0.760 (0.262) |
| Negative agri. price shock | 1.082 (0.219) |
1.291 (0.448) |
| Round dummies | Yes | Yes |
| No of observations | 2,739 | 1,135 |
| Number of households | 701 | 291 |
Note: Conditional logit model. Odds ratio presented and standard errors are in parentheses.
indicates significance at 1% level
at 5%
at 10%. All dependent variables are dummy variables.
Table A4:
Impact of regional food price increase on food insecurity in rural areas
|
|
||
|---|---|---|
| (1) | (2) | |
|
|
||
| Level of food insecurity |
||
| Outcome variables: | Moderate-or-severe | Severe |
|
|
||
| Food price increase | 1.013* (0.007) |
1.013 (0.013) |
| Health shock | 0.888 (0.188) |
0.575 (0.209) |
| Non-agri. income loss | 3.101*** (1.232) |
3.292* (2.020) |
| Loss of crop | 1.548 (0.500) |
1.300 (0.596) |
| Theft of property | 1.525 (0.487) |
0.904 (0.478) |
| Negative agri. price shock | 0.762 (0.213) |
1.664 (0.848) |
| Round dummies | Yes | Yes |
| No of observations | 1,294 | 492 |
| Number of households | 331 | 125 |
Note: Conditional logit model. Odds ratio presented and standard errors are in parentheses.
indicates significance at 1% level
at 5%
at 10%. All dependent variables are dummy variables.
Table A5:
Effect of individual food price shock on likelihood of attrition
|
|
|
|---|---|
| (1) | |
|
|
|
| Outcome variables: | Likelihood of attrition |
|
|
|
| Individual food price shock | 0.421** (0.177) |
| Health shock | 0.273** (0.153) |
| Non-agricultural income loss | 0.000 (0.000) |
| Loss of crop | 2.889 (2.811) |
| Theft of property | 0.335 (0.375) |
| Negative agricultural price shock | 0.350 (0.294) |
| No of observations | 252 |
| Number of households | 83 |
Note: Conditional logit model. Odds ratio presented and standard errors are in parentheses.
indicates significance at 1% level
at 5%
at 10%. All dependent variables are dummy variables.
Table A6:
Bounding exercise: Effect of shocks on food insecurity after assuming that missing households were completely food secure or food insecure
|
|
||||||
|---|---|---|---|---|---|---|
| (1) | (2) | (3) | (4) | (5) | (6) | |
|
|
||||||
| Original estimations | Missing food insecurity is 0 | Missing food insecurity is 1 | ||||
|
|
||||||
| Outcome variables: | Moderate-or-severe | Severe | Moderate-or-severe | Severe | Moderate-or-severe | Severe |
|
|
||||||
| Food price increase | 1.009** (0.004) |
1.007 (0.008) |
1.010** (0.004) |
1.007 (0.008) |
1.010** (0.004) |
1.007 (0.008) |
| Region dummies | Yes | Yes | Yes | Yes | Yes | Yes |
| No of observations | 3,155 | 1,265 | 3,155 | 1,265 | 3,155 | 1,265 |
| Number of households | 808 | 324 | 808 | 324 | 808 | 324 |
Note: Conditional logit model. Odds ratio presented and standard errors are in parentheses.
indicates significance at 1% level
at 5%
at 10%. All dependent variables are dummy variables.
Table A7:
Impact of regional food price increase on food insecurity with different sample sizes
|
|
||||||||
|---|---|---|---|---|---|---|---|---|
| (1) | (2) | (3) | (4) | (5) | (6) | (7) | (8) | |
|
|
||||||||
| HHs that remain in sample until last round | Sample with HHs in all four rounds | |||||||
|
|
||||||||
| Short run | Medium run | Short run | Medium run | |||||
|
|
||||||||
| Outcome variables: | Moderate-or-severe | Severe | Moderate-or-severe | Severe | Moderate-or-severe | Severe | Moderate-or-severe | Severe |
|
|
||||||||
| Food price increase | 1.008* (0.005) |
1.006 (0.008) |
1.014*** (0.005) |
1.025*** (0.010) |
1.007 (0.005) |
1.006 (0.008) |
1.014*** (0.005) |
1.027*** (0.010) |
| Health shock | 0.934 (0.127) |
0.840 (0.195) |
0.711** (0.102) |
0.388*** (0.119) |
0.959 (0.132) |
0.808 (0.191) |
0.743** (0.110) |
0.376*** (0.119) |
| Non-agri. income loss | 2.872*** (0.595) |
1.725* (0.507) |
1.033 (0.220) |
0.585 (0.215) |
2.970*** (0.621) |
1.817** (0.543) |
1.021 (0.225) |
0.491* (0.187) |
| Loss of crop | 1.540* (0.350) |
1.795* (0.539) |
1.083 (0.256) |
0.811 (0.278) |
1.507* (0.344) |
1.774* (0.535) |
1.115 (0.267) |
0.980 (0.342) |
| Theft of property | 1.201 (0.238) |
0.854 (0.268) |
1.091 (0.234) |
1.021 (0.364) |
1.169 (0.234) |
0.859 (0.270) |
1.108 (0.246) |
1.062 (0.388) |
| Negative ag. Price shock | 0.948 (0.189) |
1.276 (0.438) |
1.331 (0.279) |
0.892 (0.313) |
0.933 (0.187) |
1.271 (0.437) |
1.400 (0.306) |
0.894 (0.315) |
| No of observations | 3,023 | 1,214 | 2,574 | 973 | 2,976 | 1,192 | 2,444 | 936 |
| Number of households | 761 | 306 | 657 | 247 | 744 | 298 | 611 | 234 |
Note: Conditional logit model. Odds ratio presented and standard errors are in parentheses.
indicates significance at 1% level
at 5%
at 10%. All dependent variables are dummy variables. “HH” represents households
Footnotes
Publisher's Disclaimer: This is a PDF file of an unedited manuscript that has been accepted for publication. As a service to our customers we are providing this early version of the manuscript. The manuscript will undergo copyediting, typesetting, and review of the resulting proof before it is published in its final form. Please note that during the production process errors may be discovered which could affect the content, and all legal disclaimers that apply to the journal pertain.
Two pre-COVID-19 studies did not focus on the 2007–2008 crisis (Amolegbe et al., 2021; Hadley et al., 2012).
There is a related but distinct literature on the negative impact of COVID-19 lockdowns on food security in developing countries (Alam et al., 2022).
The phone number could be of a household member or non-household member, such as a neighbor or a friend. Originally, the goal was to ensure households could be reached if they moved, but with the spread of the COVID-19 virus, the phone numbers became the basis for surveying households
The “moderate or severe” group includes households that experienced severe food insecurity: “The reason the percentage of those experiencing moderate food insecurity only is not used as an indicator for global monitoring is because a reduction in this percentage over time would be prone to ambiguous interpretation; a reduction in moderate food insecurity could be due to movement of some of those who were suffering from moderate food insecurity into the “severe” category. Combining the moderate and severe food insecurity categories avoids such ambiguity.” (FAO, 2016b)
We excluded households that were part of the HFPS for only one round because the household fixed effect estimator requires at least two rounds of data to utilize within-household variation.
We do not include the shocks data from round 16 and food insecurity data from round 17 in the medium run estimations, because by round 17, the sample attrition was 26.9 percent, which may bias the estimates. Our results remain robust if the round 16 and 17 pair are included in our sample.
The food price indices data are downloaded from the Humanitarian Data Exchange, which is part of the United Nation’s Office for the Coordination of Humanitarian Affairs: https://data.humdata.org/dataset/faostat-food-prices-for-burkina-faso.
The frequency of each of the eight types of food insecurity experienced by households across rounds is presented in Appendix Table A1.
This means that any variable that does not change over time, and which are likely to influence our outcome variables, are captured by the household fixed and would consequently drop out of the estimations. We also do not control for variables like household assets and the number of household members because these are possibly affected by the food price increase and, therefore, are endogenous.
The dummy variable for rural area drops out of the estimations because of the household fixed effects. As households do not move over the survey rounds, the rural variable remains constant over time and therefore is captured by the household fixed effects which picks up any time invariant factor.
If the measurement error is random, it would likely bias the magnitude of the coefficient of interest lower, which would mean that our estimates are an underestimate. On the other hand, if the measurement error is fixed in nature, the inclusion of household fixed effects in our analysis would help control for it.
The advantage of using “Our World in Data” is that it collects available COVID-19 data from many sources. The data are available at https://covid.ourworldindata.org/data/owid-covid-data.csv, and a complete listing of underlying sources is at https://github.com/owid/covid-19-data/tree/master/public/data/owid-covid-codebook.csv.
We thank a reviewer for suggesting this robustness check.
References
- Action Against Hunger. (2021, June 18). Precarious situation in the Sahel, urgent action needed to face the lean season—Burkina Faso | ReliefWeb. https://reliefweb.int/report/burkina-faso/precarious-situation-sahel-urgent-action-needed-face-lean-season [Google Scholar]
- Akter S, & Basher SA (2014). The impacts of food price and income shocks on household food security and economic well-being: Evidence from rural Bangladesh. Global Environmental Change, 25, 150–162. 10.1016/j.gloenvcha.2014.02.003 [DOI] [Google Scholar]
- Alam S (2015). Parental health shocks, child labor and educational outcomes: Evidence from Tanzania. Journal of Health Economics, 44, 161–175. 10.1016/j.jhealeco.2015.09.004 [DOI] [PubMed] [Google Scholar]
- Alam S, Pörtner CC, & Ahmed I (2022). Impact of Twin Lockdowns on Hunger, Labor Market Outcomes, and Household Coping Mechanisms: Evidence from Uganda (SSRN Scholarly Paper 4269291). 10.2139/ssrn.4269291 [DOI] [Google Scholar]
- Amolegbe KB, Upton J, Bageant E, & Blom S (2021). Food price volatility and household food security: Evidence from Nigeria. Food Policy, 102, 102061. 10.1016/j.foodpol.2021.102061 [DOI] [Google Scholar]
- Andrieu N, Hossard L, Graveline N, Dugue P, Guerra P, & Chirinda N (2021). Covid-19 management by farmers and policymakers in Burkina Faso, Colombia and France: Lessons for climate action. Agricultural Systems, 190, 103092. 10.1016/j.agsy.2021.103092 [DOI] [PMC free article] [PubMed] [Google Scholar]
- Baetschmann G, Staub KE, & Winkelmann R (2015). Consistent estimation of the fixed effects ordered logit model. Journal of the Royal Statistical Society. Series A (Statistics in Society), 178(3), 685–703. [Google Scholar]
- Ballard TJ, Kepple AW, Cafiero C, & Statistics Division. (2013). The Food insecurity experience scale: Development of a global standard for monitoring hunger worldwide. FAO. https://www.fao.org/publications/card/fr/c/1f25bb40-7c4e-49e0-b79b-4d8b5e6354b5/ [Google Scholar]
- Barrett CB (2008). Spatial Market Integration. In The New Palgrave Dictionary of Economics (pp. 1–4). Palgrave Macmillan UK. 10.1057/978-1-349-95121-5_2500-1 [DOI] [Google Scholar]
- Beal T, Beldon C, Hijmans R, Mandel A, Norton M, & Riggio J (2023). Country profiles: Burkina Faso. In Sustainable Intensification Innovation Lab. http://gfc.ucdavis.edu/profiles [Google Scholar]
- Compton J, Wiggins S, & Keats S (2010). Impact of the global food crisis on the poor: What is the evidence? −. Overseas Development Institute. [Google Scholar]
- Dávila OG (2010). Food security and poverty in Mexico: The impact of higher global food prices. Food Security, 2(4), 383–393. 10.1007/s12571-010-0077-0 [DOI] [Google Scholar]
- Dorward A (2012). The short- and medium- term impacts of rises in staple food prices. Food Security, 4(4), 633–645. 10.1007/s12571-012-0210-3 [DOI] [Google Scholar]
- D’Souza A, & Jolliffe D (2012). Rising Food Prices and Coping Strategies: Household-level Evidence from Afghanistan. The Journal of Development Studies, 48(2), 282–299. 10.1080/00220388.2011.635422 [DOI] [Google Scholar]
- Egger D, Miguel E, Warren SS, Shenoy A, Collins E, Karlan D, Parkerson D, Mobarak AM, Fink G, Udry C, Walker M, Haushofer J, Larreboure M, Athey S, Lopez-Pena P, Benhachmi S, Humphreys M, Lowe L, Meriggi NF, … Vernot C (2022). Falling living standards during the COVID-19 crisis: Quantitative evidence from nine developing countries. Science Advances, 7(6), Article 6. 10.1126/sciadv.abe0997 [DOI] [PMC free article] [PubMed] [Google Scholar]
- Erokhin V, & Gao T (2020). Impacts of COVID-19 on Trade and Economic Aspects of Food Security: Evidence from 45 Developing Countries. International Journal of Environmental Research and Public Health, 17(16), Article 16. 10.3390/ijerph17165775 [DOI] [PMC free article] [PubMed] [Google Scholar]
- Fafchamps M, & Gavian S (1996). The Spatial Integration of Livestock Markets in Niger. Journal of African Economies, 5(3), 366–405. 10.1093/oxfordjournals.jae.a020912 [DOI] [Google Scholar]
- Famine Early Warning System Network. (2017, October 2). Burkina Faso Staple Food and Livestock Market Fundamentals—September 2017—Burkina Faso | ReliefWeb. https://reliefweb.int/report/burkina-faso/burkina-faso-staple-food-and-livestock-market-fundamentals-september-2017 [Google Scholar]
- FAO. (2015). Modeling Food Insecurity in Bivariate and Regression Analyses: Prepared by the Voices of the Hungry Team. [Google Scholar]
- FAO. (2016a). Global Food Insecurity Experience Scale Survey Modules. [Google Scholar]
- FAO. (2016b). The Food Insecurity Experience Scale Frequently Asked Questions-FAQs WHAT does the Food Insecurity Experience Scale measure ? https://www.semanticscholar.org/paper/The-Food-Insecurity-Experience-Scale-Frequently-the/c89d8bd0c7fddd8d7805e01db7b9508ee88d806e [Google Scholar]
- FAO. (2022, October 11). FAO GIEWS Country Brief on Burkina Faso −. https://www.fao.org/giews/countrybrief/country.jsp?code=BFA [Google Scholar]
- Hadley C, Linzer DA, Belachew T, Mariam AG, Tessema F, & Lindstrom D (2011). Household capacities, vulnerabilities and food insecurity: Shifts in food insecurity in urban and rural Ethiopia during the 2008 food crisis. Social Science & Medicine, 73(10), 1534–1542. 10.1016/j.socscimed.2011.09.004 [DOI] [PMC free article] [PubMed] [Google Scholar]
- Hadley C, Stevenson EGJ, Tadesse Y, & Belachew T (2012). Rapidly rising food prices and the experience of food insecurity in urban Ethiopia: Impacts on health and well-being. Social Science & Medicine, 75(12), 2412–2419. 10.1016/j.socscimed.2012.09.018 [DOI] [PubMed] [Google Scholar]
- Headey. (2012). Was the Global Food Crisis Really a Crisis? Simulations Versus Self-Reporting. http://dspace.wunu.edu.ua//handle/316497/31545 [Google Scholar]
- Headey. (2013). The Impact of the Global Food Crisis on Self-Assessed Food Security. The World Bank Economic Review, 27(1), 1–27. [Google Scholar]
- Headey D, & Martin WJ (2016). The Impact of Food Prices on Poverty and Food Security. Annual Review of Resource Economics, 8(1), 329–351. 10.1146/annurev-resource-100815-095303 [DOI] [Google Scholar]
- IDMC. (2020). 2020 Global Report on Internal Displacement. https://www.internal-displacement.org/global-report/grid2020/ [Google Scholar]
- Jacobs P (2010). Household food insecurity, rapid food price inflation and the economic downturn in South Africa. Agenda: Empowering Women for Gender Equity, 86, 38–51. [Google Scholar]
- Kansiime MK, Tambo JA, Mugambi I, Bundi M, Kara A, & Owuor C (2021). COVID-19 implications on household income and food security in Kenya and Uganda: Findings from a rapid assessment. World Development, 137, 105199. 10.1016/j.worlddev.2020.105199 [DOI] [PMC free article] [PubMed] [Google Scholar]
- Lamarche A (2021, May 5). Atrocities and Displacement in Burkina Faso. Refugees International. https://www.refugeesinternational.org/reports/2021/5/5/atrocities-and-displacement-in-burkina-faso [Google Scholar]
- Laudien R, Schauberger B, Waid J, & Gornott C (2022). A forecast of staple crop production in Burkina Faso to enable early warnings of shortages in domestic food availability. Scientific Reports, 12(1), Article 1. 10.1038/s41598-022-05561-9 [DOI] [PMC free article] [PubMed] [Google Scholar]
- Madzorera I, Ismail A, Hemler EC, Korte ML, Olufemi AA, Wang D, Assefa N, Workneh F, Lankoande B, Chukwu A, Ourohire M, Mattei J, Soura A, Berhane Y, Sie A, Oduola A, & Fawzi WW (2021). Impact of COVID-19 on Nutrition, Food Security, and Dietary Diversity and Quality in Burkina Faso, Ethiopia and Nigeria. The American Journal of Tropical Medicine and Hygiene, 105(2), 295–309. 10.4269/ajtmh.20-1617 [DOI] [PMC free article] [PubMed] [Google Scholar]
- Mathieu E, Ritchie H, Rodés-Guirao L, Appel C, Giattino C, Hasell J, Macdonald B, Dattani S, Beltekian D, Ortiz-Ospina E, & Roser M (2020). Coronavirus Pandemic (COVID-19). Our World in Data. https://ourworldindata.org/coronavirus/country/burkina-faso [Google Scholar]
- Moser C, Barrett C, & Minten B (2009). Spatial integration at multiple scales: Rice markets in Madagascar. Agricultural Economics, 40(3), 281–294. 10.1111/j.1574-0862.2009.00380.x [DOI] [Google Scholar]
- Pitt MM, & Rosenzweig MR (1990). Estimating the Intrahousehold Incidence of Illness: Child Health and Gender-Inequality in the Allocation of Time. International Economic Review, 31(4), 969–989. 10.2307/2527025 [DOI] [Google Scholar]
- Ravallion M (1986). Testing Market Integration. American Journal of Agricultural Economics, 68(1), 102–109. 10.2307/1241654 [DOI] [Google Scholar]
- ReliefWeb. (2021, March 22). West and Central Africa: Market situation in 2020 and 2021 outlooks - March 2021 - Burkina Faso. West and Central Africa: Market Situation in 2020 and 2021 Outlooks - March 2021. https://reliefweb.int/report/burkina-faso/west-and-central-africa-market-situation-2020-and-2021-outlooks-march-2021 [Google Scholar]
- Rose E (2000). Gender Bias, Credit Constraints and Time Allocation in Rural India. The Economic Journal, 110(465), 738–758. 10.1111/1468-0297.00563 [DOI] [Google Scholar]
- Sophal C (2011). The impact of high food prices on food security in Cambodia. Development in Practice, 21(4–5), 718–731. 10.1080/09614524.2011.561294 [DOI] [Google Scholar]
- UNHCR. (2021). UNHCR Burkina Faso Factsheet—1 January—31 October 2021—Burkina Faso |. https://reliefweb.int/report/burkina-faso/unhcr-burkina-faso-factsheet-1-january-31-october-2021 [Google Scholar]
- UNHCR. (2023). Country—Burkina Faso. https://data.unhcr.org/en/country/bfa/594 [Google Scholar]
- UN-OCHA. (2021a). Burkina Faso: Déplacements au Centre-Nord, Flash Update No. 3 (23 décembre 2021) - Burkina Faso | ReliefWeb. [Google Scholar]
- UN-OCHA. (2021b, January 29). Burkina Faso: Aperçu de la situation humanitaire (Au 31 décembre 2020) - Burkina Faso | ReliefWeb. https://reliefweb.int/report/burkina-faso/burkina-faso-aper-u-de-la-situation-humanitaire-au-31-d-cembre-2020 [Google Scholar]
- UN-OCHA. (2021c, December 13). Burkina Faso: Déplacements au Centre-Nord, Flash Update No. 2 (13 décembre 2021) - Burkina Faso. https://reliefweb.int/report/burkina-faso/burkina-faso-d-placements-au-centre-nord-flash-update-no-2-13-d-cembre-2021 [Google Scholar]
- UN-OCHA. (2022, February 22). Burkina Faso: Aperçu de la situation humanitaire (Au 31 décembre 2021) - Burkina Faso | ReliefWeb. https://reliefweb.int/report/burkina-faso/burkina-faso-aper-u-de-la-situation-humanitaire-au-31-d-cembre-2021 [Google Scholar]
- USAID. (2020). Sub-national crop calendars | Agrilinks. https://agrilinks.org/covid-19-mitigation-and-crop-cycle-models/sub-national-crop-calendars [Google Scholar]
- USAID. (2022, October 13). Food Assistance Fact Sheet—Burkina Faso | Food Assistance. U.S. Agency for International Development. https://www.usaid.gov/food-assistance/burkina-faso [Google Scholar]
- USDA. (2023). Burkina Faso Production. https://ipad.fas.usda.gov/countrysummary/default.aspx?id=UV [Google Scholar]
- Verpoorten M, Arora A, Stoop N, & Swinnen J (2013). Self-reported food insecurity in Africa during the food price crisis. Food Policy, 39, 51–63. 10.1016/j.foodpol.2012.12.006 [DOI] [Google Scholar]
- WFP. (2022, November 2). WFP Burkina Faso Country Brief, September 2022—Burkina Faso. https://reliefweb.int/report/burkina-faso/wfp-burkina-faso-country-brief-september-2022 [Google Scholar]
- WFP. (2023, April 26). Burkina Faso | World Food Programme. https://www.wfp.org/countries/burkina-faso [Google Scholar]
- World Bank. (2021). Burkina Faso, 2021 April Economic Update. http://hdl.handle.net/10986/35735 [Google Scholar]
- World Bank. (2023). High Frequency Phone Survey 2020–2023 [dataset]. World Bank, Development Data Group. 10.48529/YYYB-A265 [DOI] [Google Scholar]