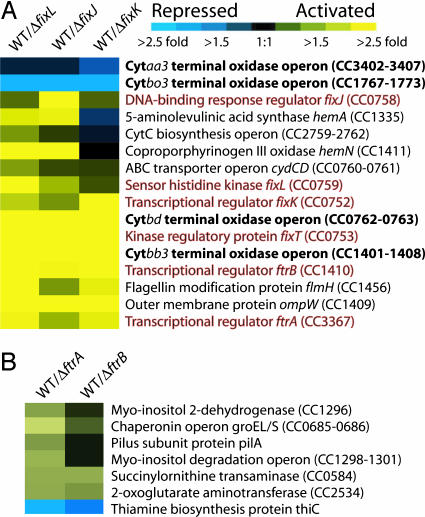
Fig. 2.
Microarray cluster presenting expression of genes in fixL, fixJ, fixK, ftrA, and ftrB deletion backgrounds relative to wild-type C. crescentus strain CB15. Relative expression of genes in wild-type C. crescentus versus mutant strains was calculated by dividing average wild-type expression by average mutant expression values (n = 4). All strains (deletion and wild-type reference) were subjected to oxygen depletion to induce the FixLJ two-component system. Data are clustered and shown for wild type versus ΔfixL, ΔfixJ, and ΔfixK (A) and ΔftrA and ΔftrB (B) strains. Yellow indicates genes that are positively regulated by a given transcription regulator (higher expression in wild-type cells versus mutant), whereas blue indicates genes that are repressed by a given transcriptional regulator (higher expression in mutant cells versus wild-type). A color scale is included above A. The respiratory terminal oxidase operons are highlighted in bold text, whereas the sensory and transcriptional regulatory components of the FixLJ two-component network are in red text. A complete list of all genes that showed statistically significant change can be found in Table 4.

