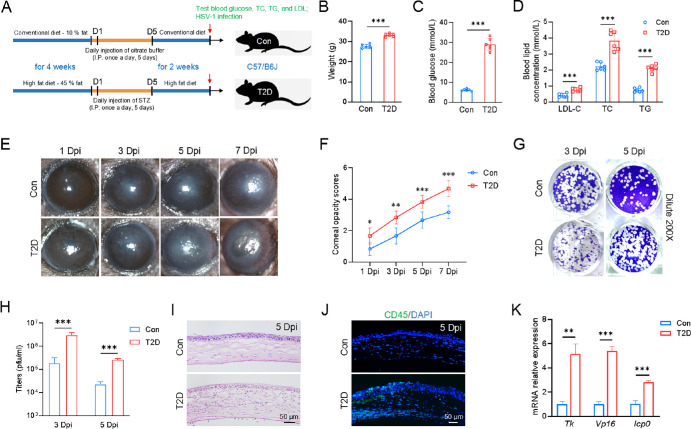
Figure 1.
Increased susceptibility of T2D mice to HSV-1 infection. (A) Schematic illustrating the generation of T2D mice. (B–D) Compared to control mice, T2D mice had higher body weight, blood glucose levels, and blood lipid levels. LDL-C, low density lipoprotein cholesterol; TC, total cholesterol; TG, triglyceride (N = 6 per group). (E) Slit-lamp images demonstrated that T2D mice had a more severe corneal phenotype than control mice following HSV-1 infection. Dpi, days post infection. (F) Corneal opacity scores were significantly high in T2D mice compared to control mice (n = 6 per group). (G) Representative images of plaque assay at 3 and 5 Dpi. The viral samples were diluted 200 times. (H) Virus titers in T2D mice were clearly higher than those in the control mice (n = 3 per group). (I) H&E staining of corneal sections (n = 3 per group). (J) More immune cells infiltrated the cornea of T2D mice (n = 3 per group). (K) Quantitative PCR analysis of HSV-1 viral genes (Tk, Vp16, and Icp0). Mouse Rpl5 (m-Rpl5) was used as an internal control (n = 3 per group). *P < 0.05, **P < 0.01, ***P < 0.001.

