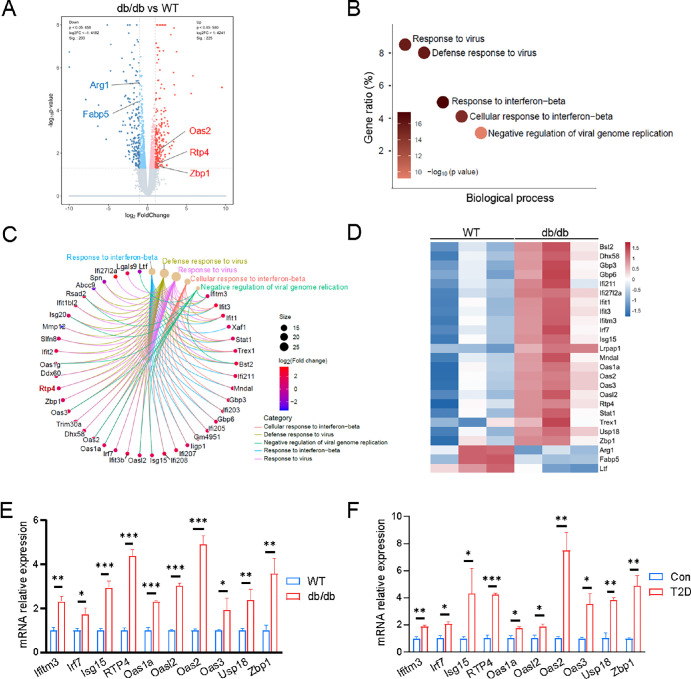
Figure 2.
Enhanced virus response genes expression in corneal epithelium of db/db mice and T2D mice. (A) Volcano plot illustrates the differential mRNA expression profile of corneal epithelia between WT and db/db mice. (B) Top five terms of the GO biological process enrichment analysis of significantly dysregulated genes in the corneal epithelium. (C) The cnetplot visualization depicts the enrichment of dysregulated genes from the top five enriched categories. (D) Heat map of representative virus response-related genes. (E, F) Quantitative PCR analysis validates the enhanced expression of virus response genes in corneal epithelia of both db/db and T2D mice, compared to controls. m-β-actin served as an internal control. *P < 0.05, **P < 0.01, ***P < 0.001.

