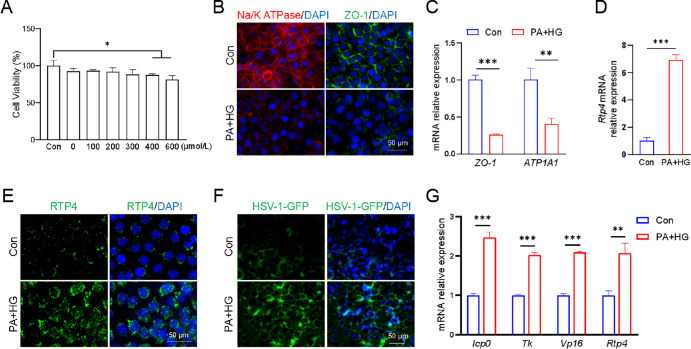
Figure 4.
Both RTP4 expression and HSV-1 infection were enhanced in a T2D cell model. (A) Cell viability assay of HCECs treated with different PA concentrations for 24 hours. Then HCECs were treated with 300 µmol/L PA and HG medium to induce the T2D cell model, whereas HCECs were cultured in DMEM/F12 medium as a control group. (B) Representative immunofluorescence images of ATP1A1 and ZO-1 in control HCECs and PA + HG-treated HCECs. (C) Quantitative PCR analysis of ATP1A1 and ZO-1 gene expression. (D) Quantitative PCR analysis of Rtp4 gene expression. (E) Representative immunofluorescence images of RTP4. (F) Representative images showing GFP-labeled HSV-1 infection post 24 hours. (G) Quantitative PCR analysis of HSV-1 viral genes and Rtp4 gene in Figure 4F. Human β-actin (h-β-actin) served as an internal control. *P < 0.05, **P < 0.01, ***P < 0.001.

