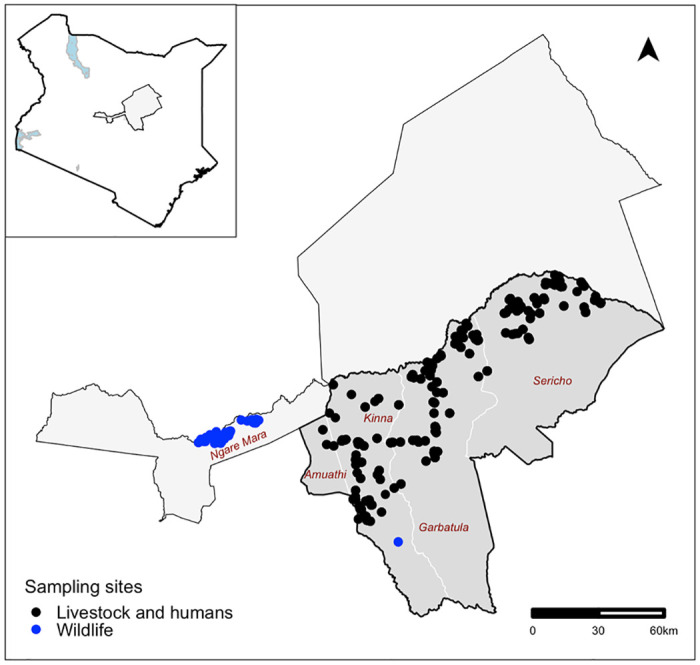
Fig 1. A map showing the sampling sites in Isiolo County, Kenya.

The black dots represent the locations where livestock and human samples were collected from, while the blue dots represent areas where wild animals were sampled. The shapefile used to create the map was obtained from: https://gadm.org/download_country.html.
