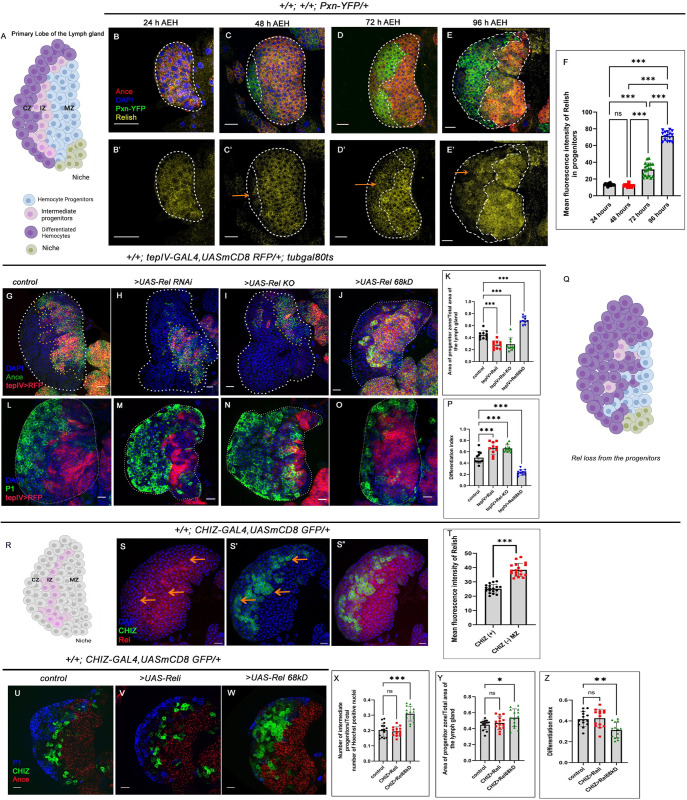
Fig 1. Loss of Relish from the progenitor cells causes precocious differentiation.
(A) Scheme of the Primary lobe of the third instar larval lymph gland with different cell types present in it. (B- E’) Relish (yellow) is enriched in progenitors (Ance: red), whereas downregulated in the differentiated cells (arrows, Pxn: green). (F) Mean fluorescence intensity of Rel expression in the progenitors Fig 1B-1E’ (lymph glands n≥12, P-values from left to right <0.923, <0.001, <0.001, <0.001, <0.001 and <0.001 respectively). (G-J) Compared to control (G), Rel loss of function by RNAi (H) or progenitor-specific knockout of Rel by CRISPR/Cas9 system significantly reduces the number of progenitors (Ance, I). Rel overexpression expands the progenitor zone (Ance, J). (K) The ratio of the area of progenitors to that of the total area of the primary lobe for the genotypes G-J (lymph glands n = 10, P-values from left to right <0.001, <0.001 and <0.001 respectively). (L-O) Rel loss from the progenitor leads to increased differentiation (P1: green, M-N) compared to that of the control (L), whereas Rel overexpression affects progenitor differentiation (P1: green, O). (P) Differentiation index for genotypes L-O (lymph glands n≥10 for each genotype, P-values from left to right <0.001, <0.001 and <0.001 respectively). (Q) Schematic representation of the phenotype obtained upon rel loss from the progenitors. (R) Scheme represents the IZ (pink) within the mature lymph gland. (S-S") Co-labeling of Rel with CHIZ>GFP reveals that the expression of Rel is down regulated in CHIZ expressing cells. (T) Quantitation of the results from S-S". (lymph glands n = 18 for mentioned genotype, P-value < .001). (U-W) Downregulation of Rel from the intermediate progenitor did not affect their number (CHIZ: green, V), nor differentiation (blue, V) or progenitor (red, V) area compared to that of the control (U), whereas overexpression of Rel causes an increase in the number of intermediate progenitors (W). (X) The ratio of the intermediate progenitors to the total number of cells in the primary lobe for the genotypes U-W. (lymph glands n = 14 for each genotype; P values: 0.843 and <0.001 respectively). (Y) The ratio of the area of progenitors to that of the total area of the primary lobe for the genotypes Fig U-W (lymph gland n = 14, P-values from left to right = 0 .768 and = 0 .027, respectively). (Z) Differentiation index for genotypes Fig U-W (lymph gland n = 14, P-values from left to right = 0.947 and <0.003 respectively). Genotypes are as mentioned. Each dot in the graph represents individual values, and Data is expressed as mean ± SD. Statistical analysis: Tukey’s multiple comparisons tests. Unpaired t-test with Welch’s correction for T. P-Value of <0.05, <0.01 and<0.001, mentioned as *, **, *** respectively. Scale bar: 20μ, DAPI: nucleus.

